Author: Lucas Peterson
-
DYNEX
•
Current Market Context Dynex represents our most speculative yet potentially lucrative trade. We view Dynex in a similar light to Ethereum in 2015, with massive upside potential and an incredibly undervalued position. With a limited supply of 110 million Dynex and a current price of around $0.20, the market capitalization…
-
Injective
•
Injective is our favorite altcoin, and we hold a strong conviction in its long-term potential. While we acknowledge that we are in the late stages of the bull market, we believe Injective has the potential for one more strong upward move before entering a broader market correction. Our target for…
-
FETCH.AI
•
Fetch.AI (FET) is another highly promising AI-focused token, similar to Render. Its strong narrative within the AI sector has driven significant attention and market momentum. However, we believe FET is currently within an ending diagonal pattern, signaling the final stages of a bullish macro wave. Technically, the chart suggests a…
-
RENDER
•
Current Market Context Render is one of the most promising altcoins in the current market, driven by the ongoing AI hype that boosts its adoption and visibility. We believe that Render is currently within its final macro bullish wave before a significant correction sets in. The wave structure indicates a…
-

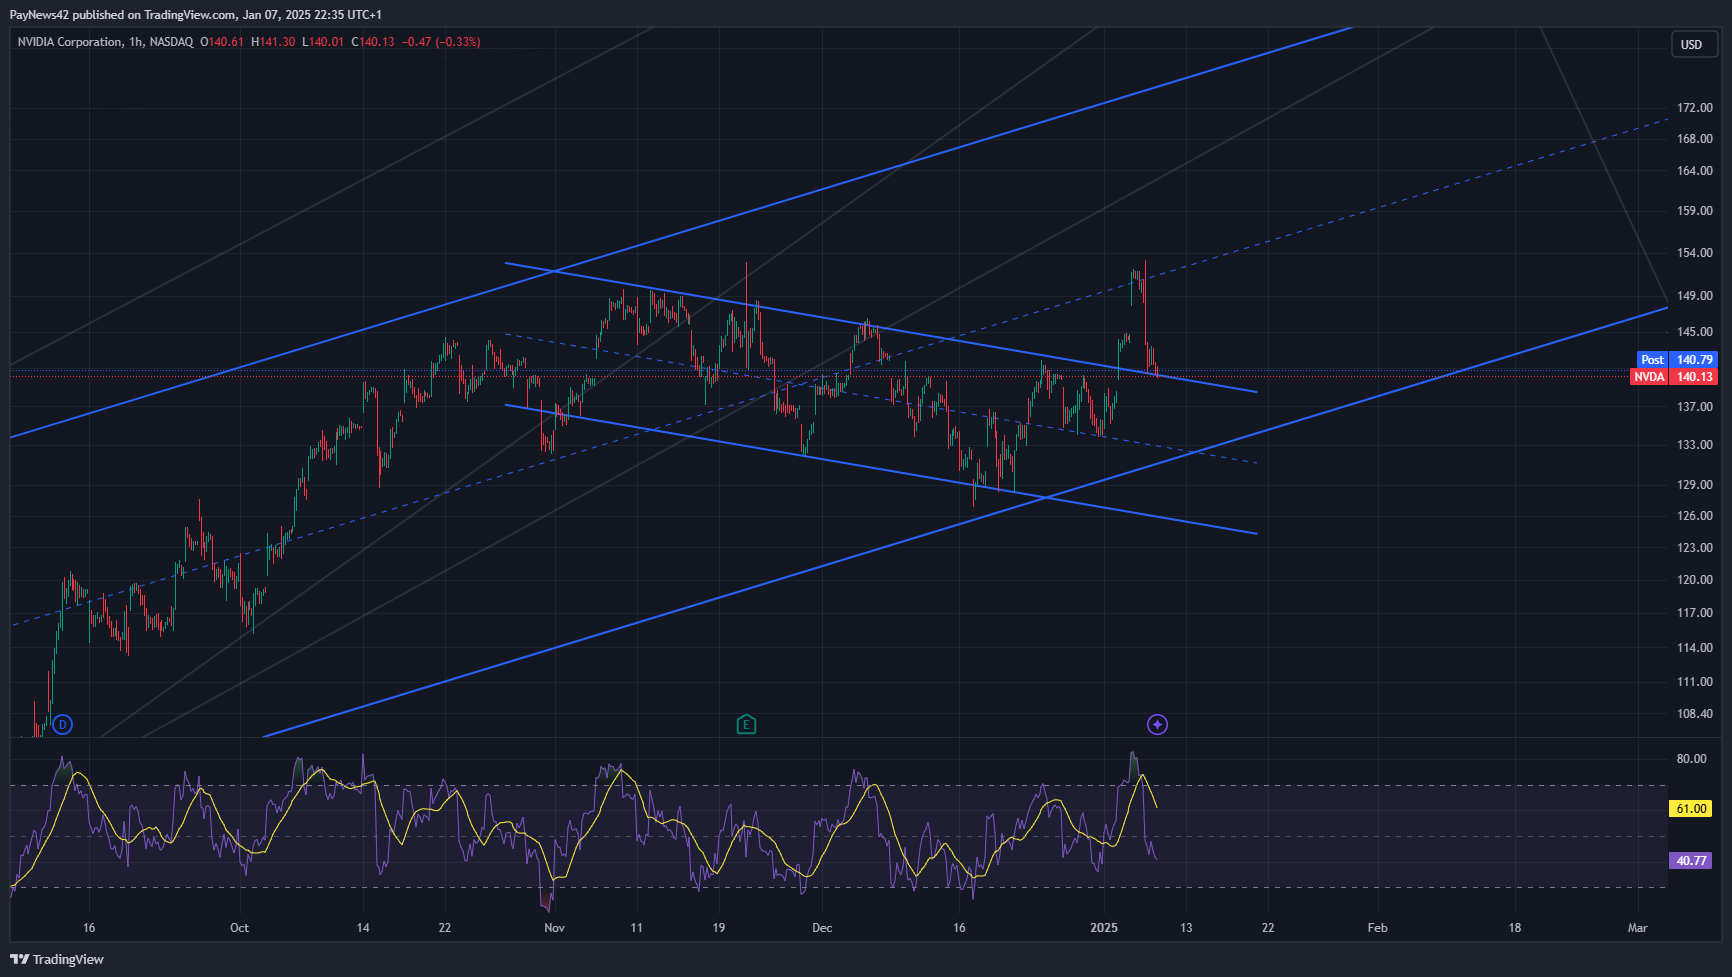
NVIDIA Research Report: Technical Analysis and Product Innovations January 2025!
•
DISCLAIMER: This is not financial advice. All information provided is for educational and entertainment purposes only. Trading and investing carry substantial risks – always conduct your own research and due diligence before making any investment decisions. Technical Analysis NVIDIA’s stock price is currently in a critical technical phase. After several…
-
•
Cytel42 Developers Individuals Institutions Ecosystem Press About The blockchain built for finance Build and use the best Web3 applications on Cytel42, the fastest layer 1 blockchain shaping the future of finance. Start Building Explore Ecosystem Oracle Derivatives Lending Order Book Smart Contracts Options Savings
-
Solana
•
Status: BUY/HOLD Solana remains one of the strongest and most significant positions in our portfolio. While we still expect a robust performance in 2025, we believe a mid-term target of $750 is unlikely. Instead, we view a cycle top of around $400 as a more realistic projection. To achieve this…
-
Ethereum
•
Ethereum, despite moments of doubt, is still firmly within its bull market structure. While Bitcoin has consistently outperformed Ethereum throughout this cycle, we believe Ethereum has the potential to massively outperform Bitcoin in the coming weeks and months. Ethereum is trading within a rising channel, and each upward movement follows…
-
Bitcoin
•
Following our analysis from December 22, 2024, our assumption that Bitcoin might enter a corrective phase has materialized. At that time, we outlined two potential scenarios: Current Situation Now, weeks later, the price action supports Scenario 1 as the most likely outcome. We believe the market remains in the corrective…
