Author: Lucas Peterson
-
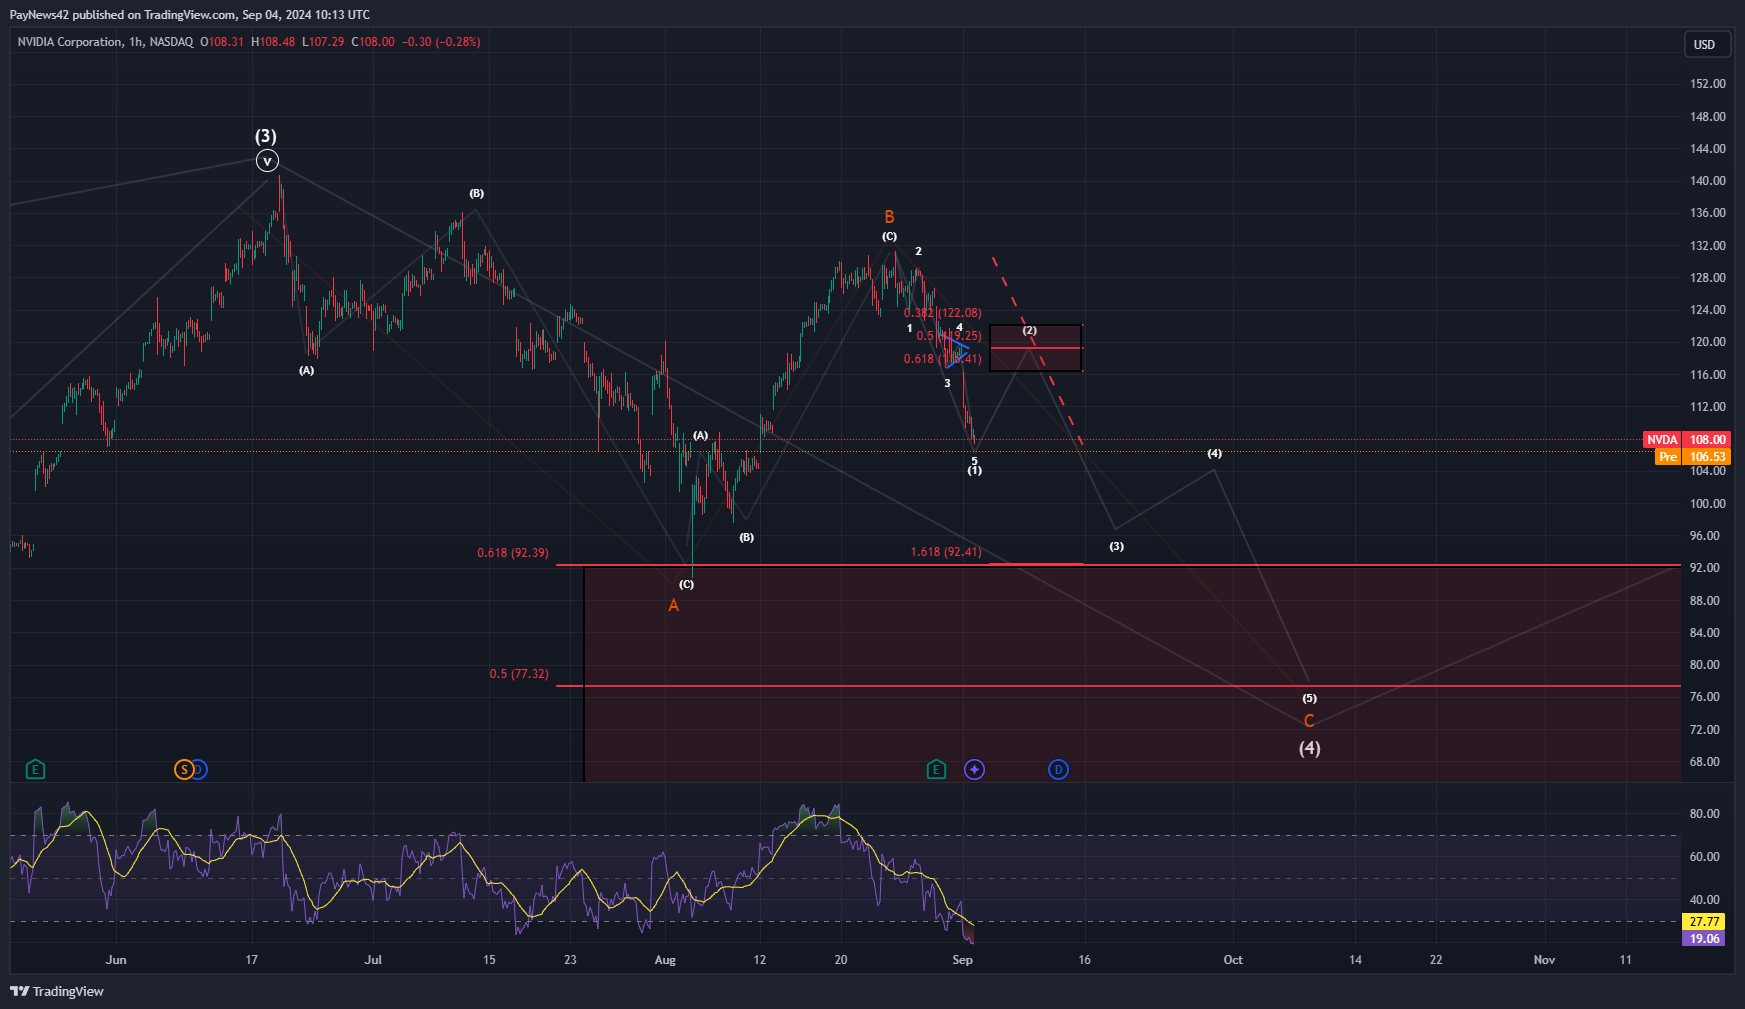
Nvidia Low Time Frame Analysis
•
Recent Update: Wave Count Explanation: Bigger Picture: Fibonacci Levels: Short-Term Outlook: Conclusion:
-
Have The Bears Won?
•
Current Market Situation: Wave Count Explanation: Technical Patterns and Indicators: Fibonacci Levels: Conclusion: Be mindful of potential downside if the wedge fails to hold, but at the moment, the bullish scenario still holds as the most likely outcome. Current Market Situation: Wave Count Explanation: Technical Patterns and Indicators: Fibonacci Levels:…
-
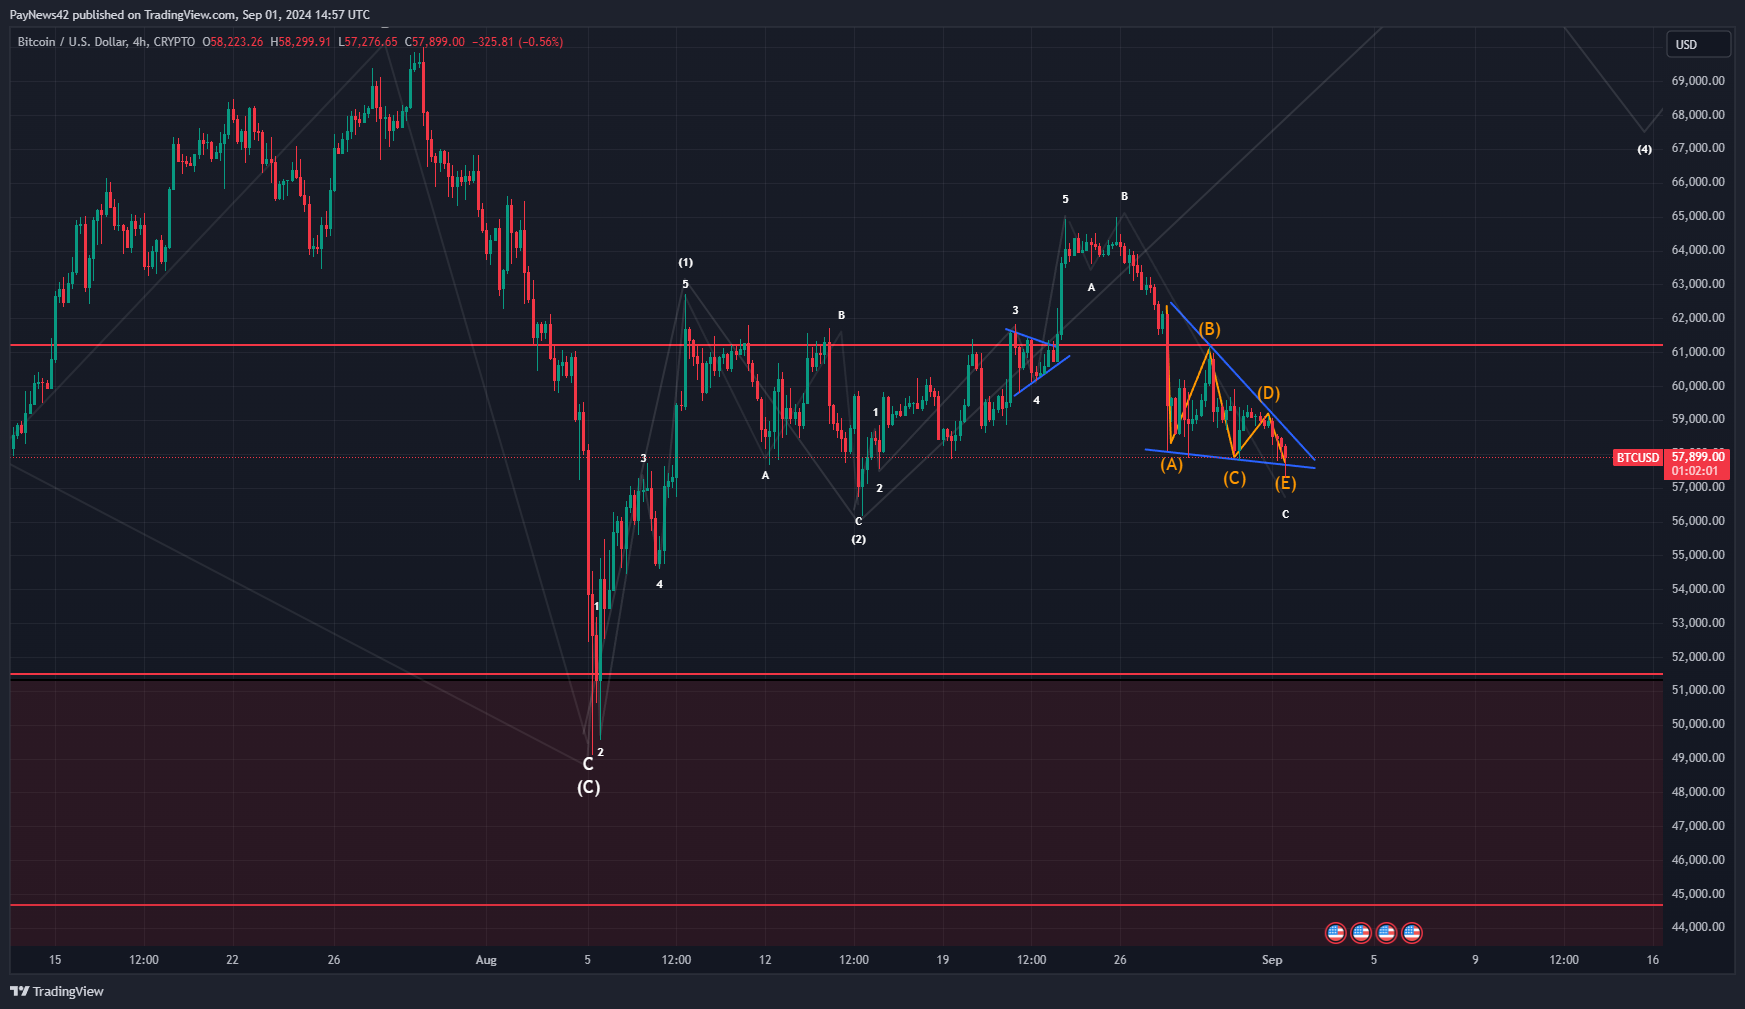
Bitcoin Low-Time-Frame Analysis
•
The chart illustrates a complex Elliott Wave structure and a potential falling wedge pattern, which is a key focus for the current price action. Let’s break it down: Conclusion: The market is at a critical juncture. A bullish breakout from the falling wedge would align with the larger Elliott Wave…
-
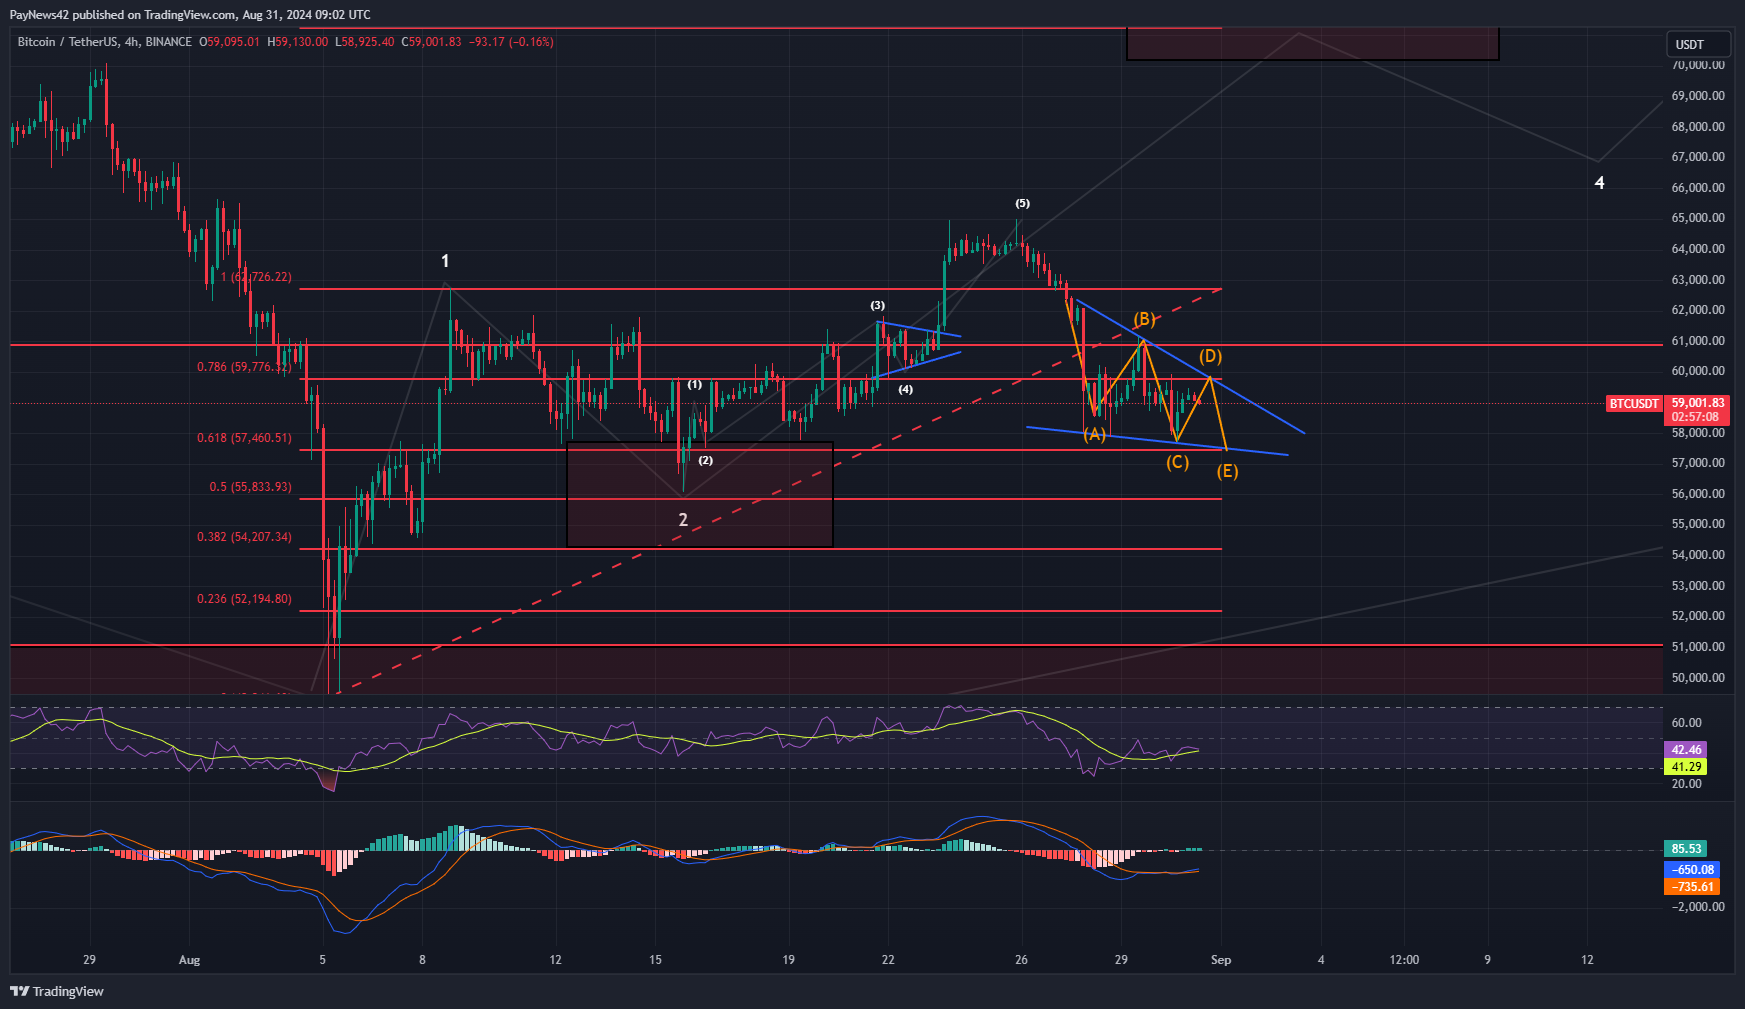
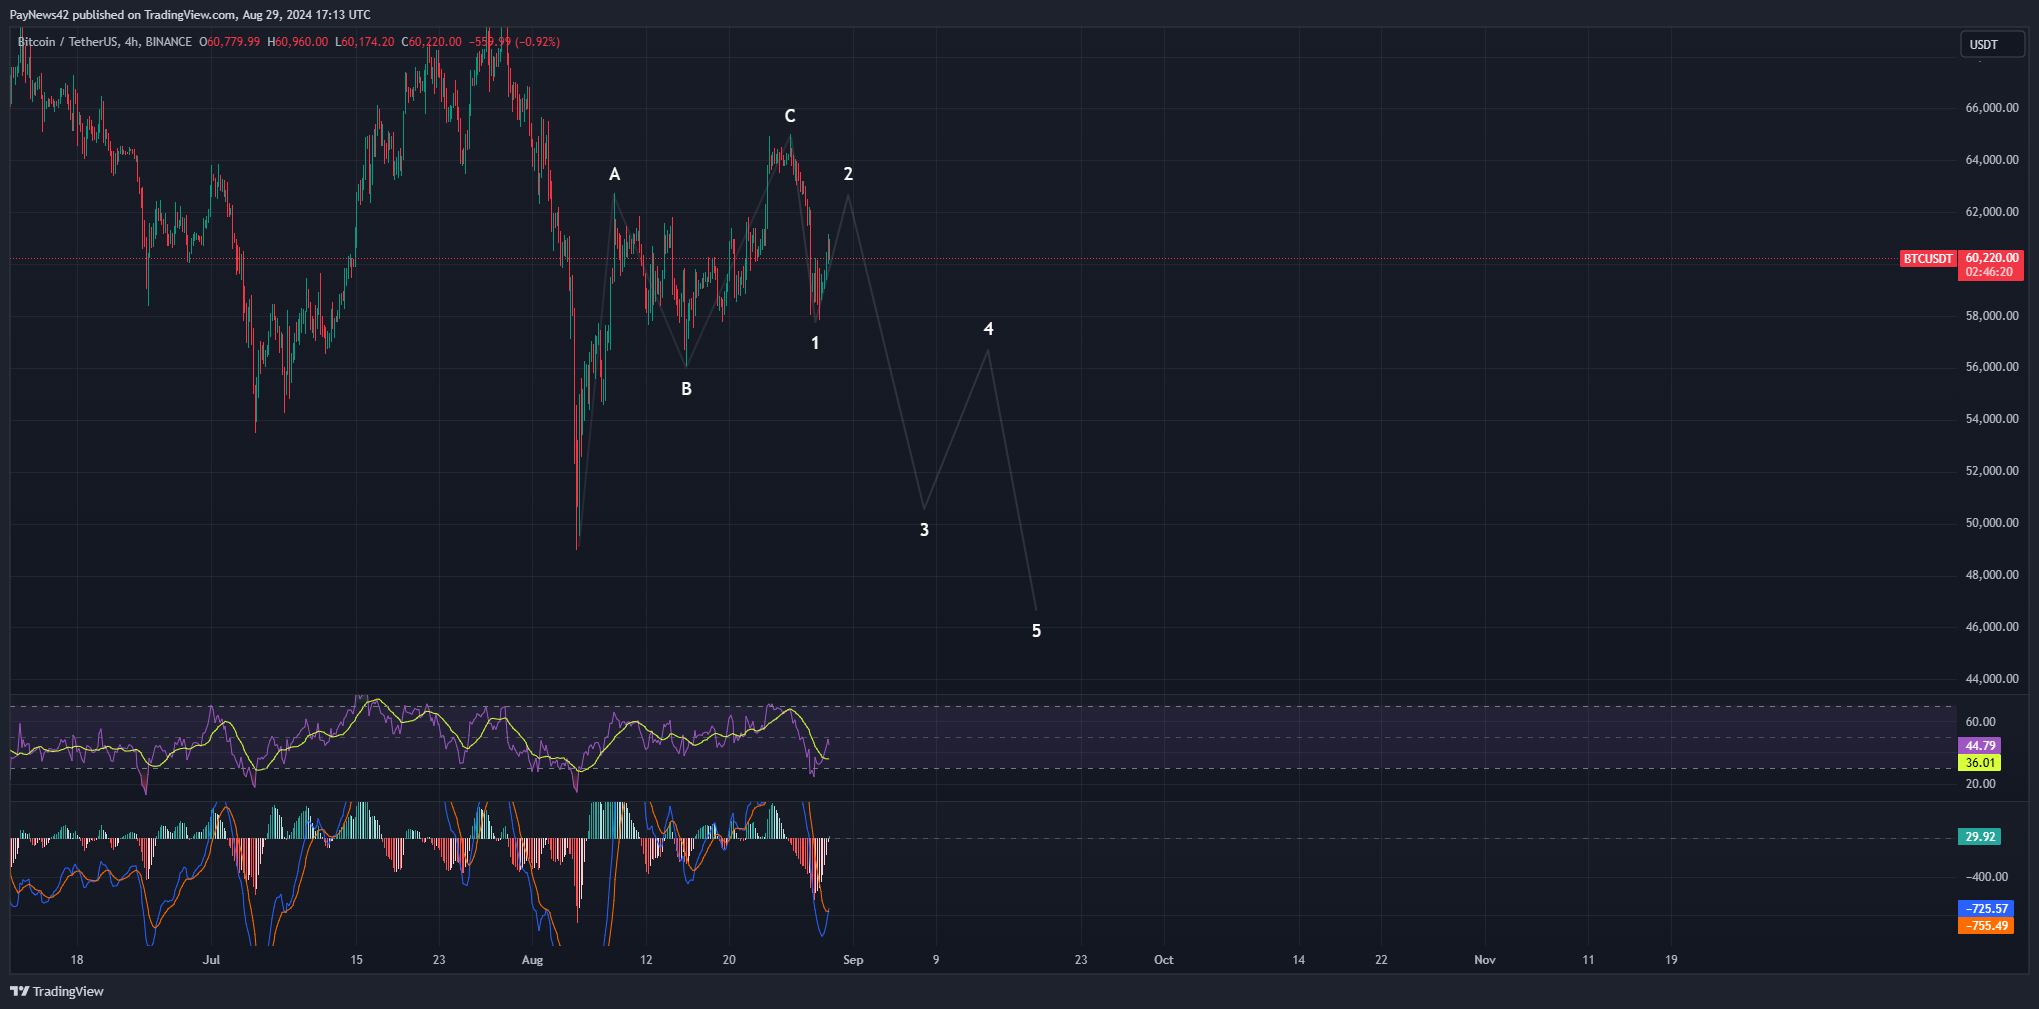
Bitcoin Low-Time-Frame Analysis
•
Bitcoin is currently moving within a falling triangle formation. Although this pattern is developing on a lower time frame, making it more fragile, it is still maintaining its structure. The falling triangle is typically seen as a bullish continuation pattern, especially when it occurs during a correction phase within an…
-
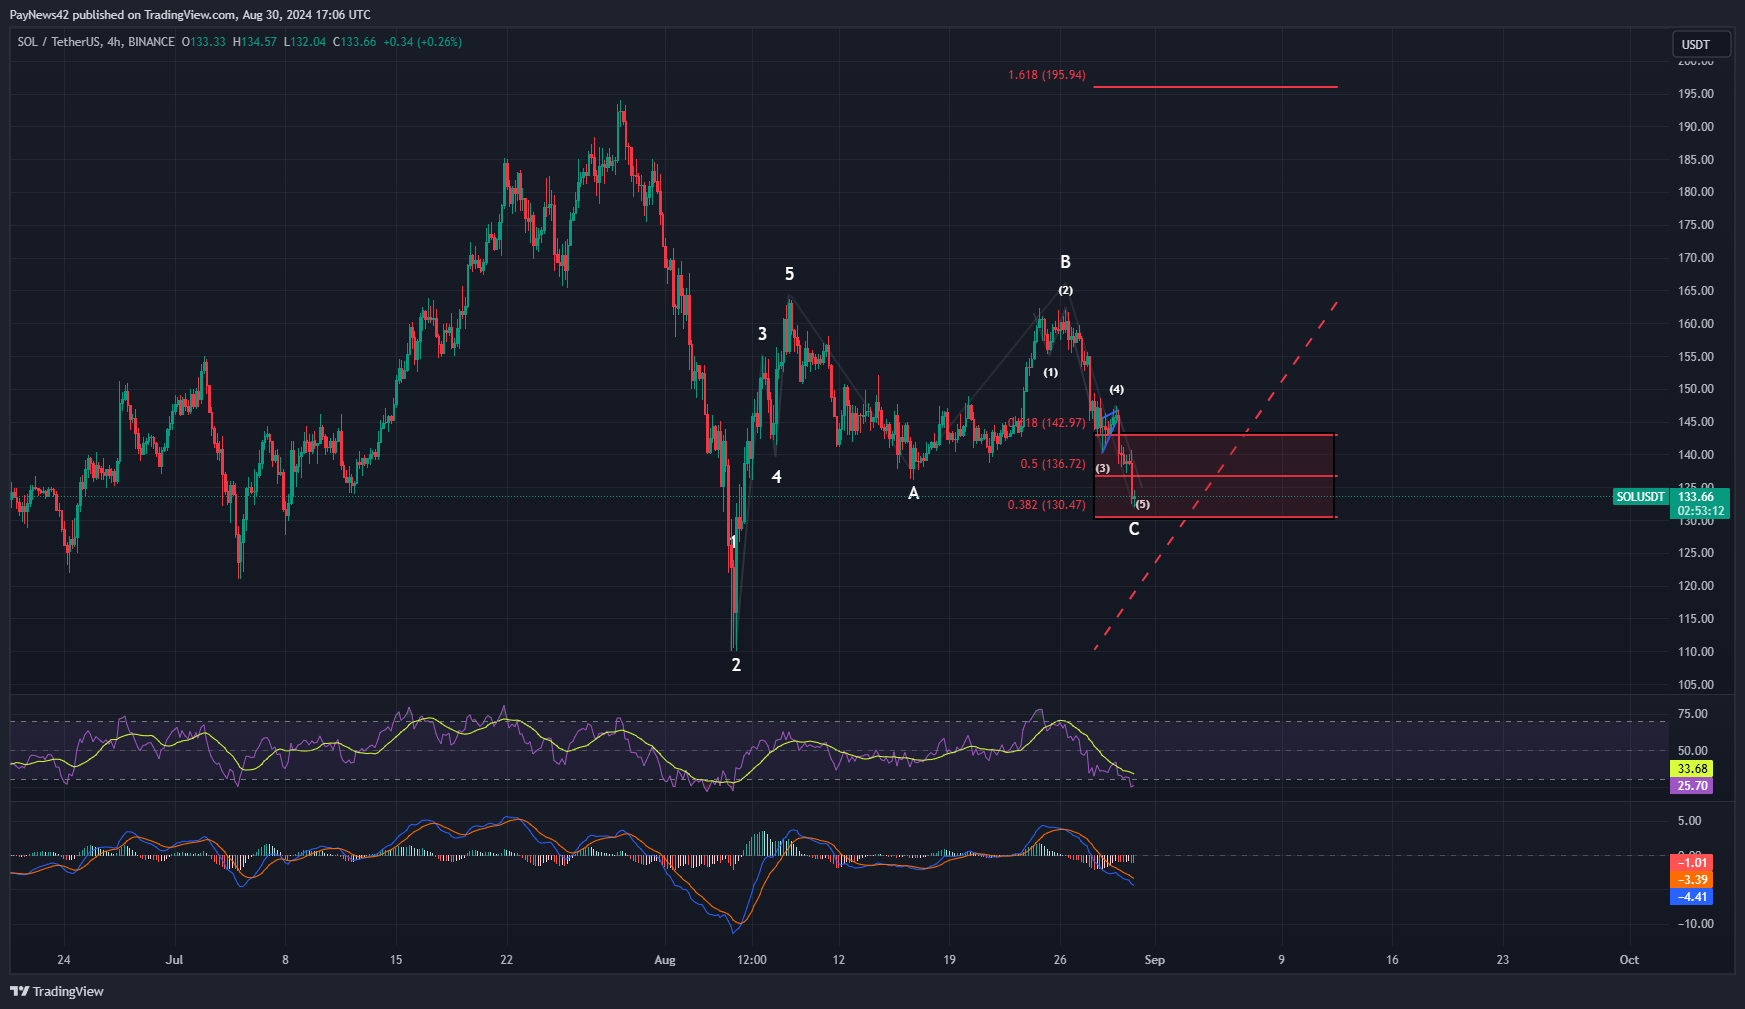
Solana (SOL) Low Time Frame Analysis
•
After reaching a local top around $165, Solana has entered into a well-defined downtrend. Based on our wave count, the market is currently undergoing a classic ABC correction. The structure of this correction appears to be well-formed, and when we examine the broader market structure, it could be interpreted as…
-
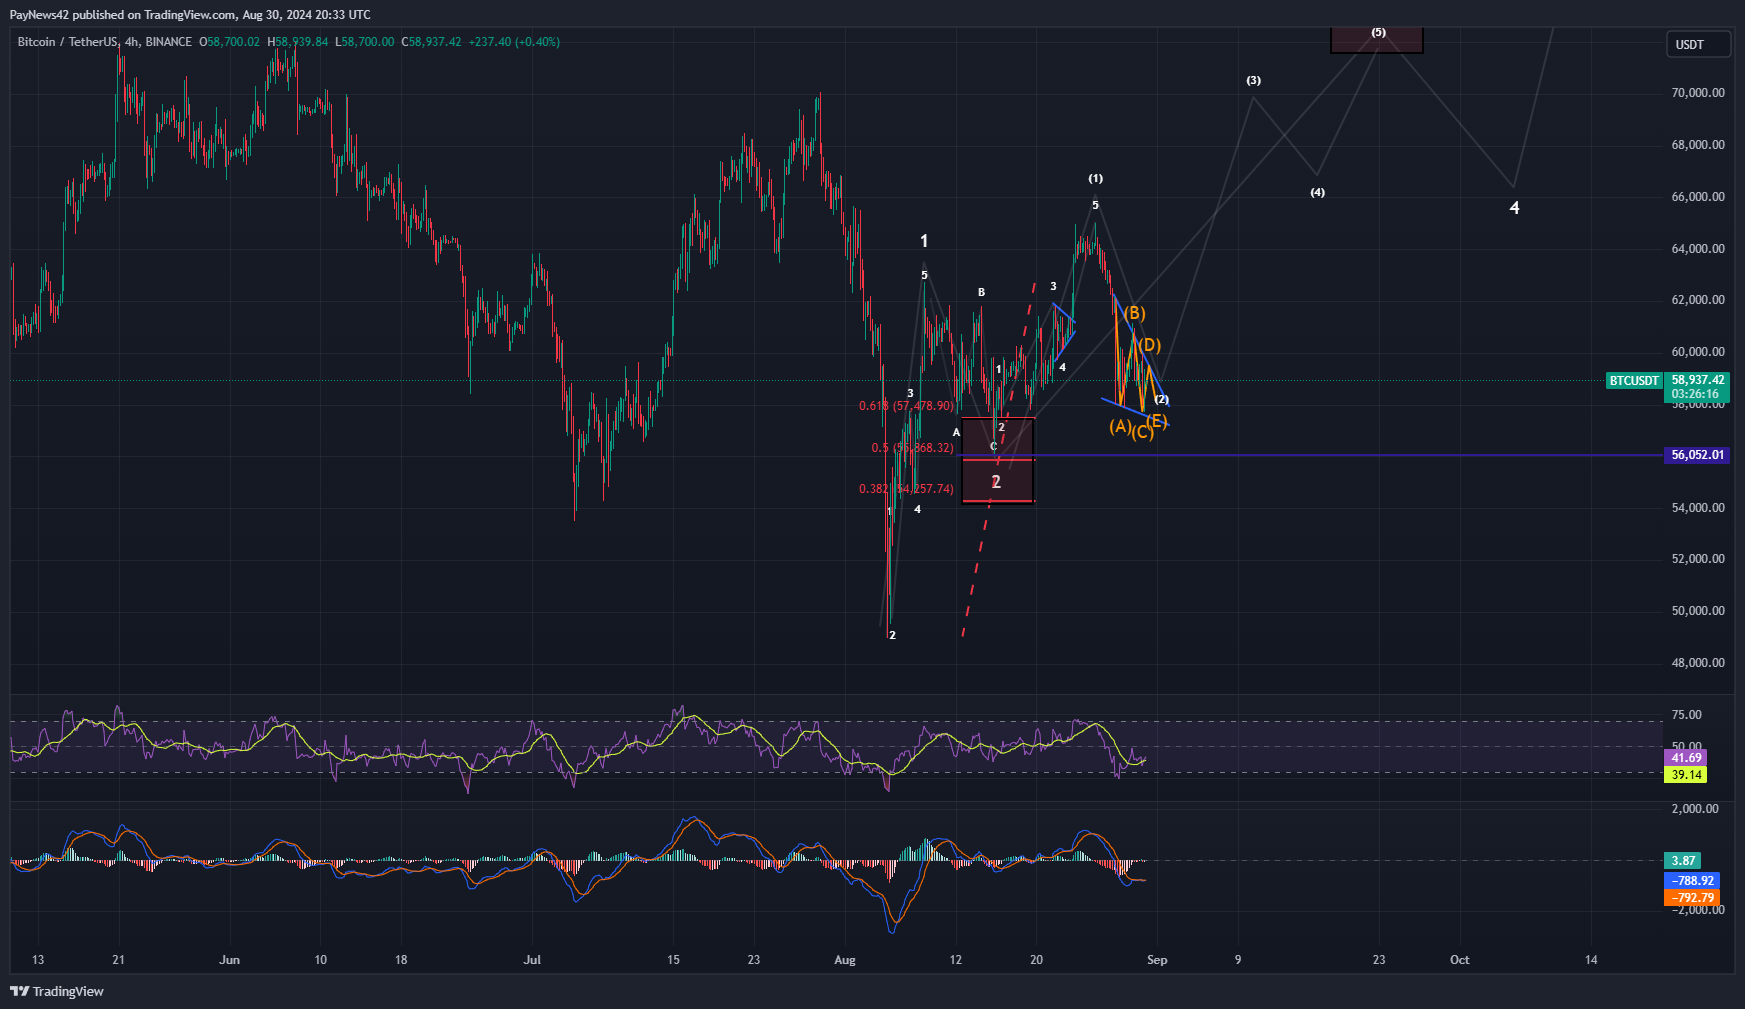
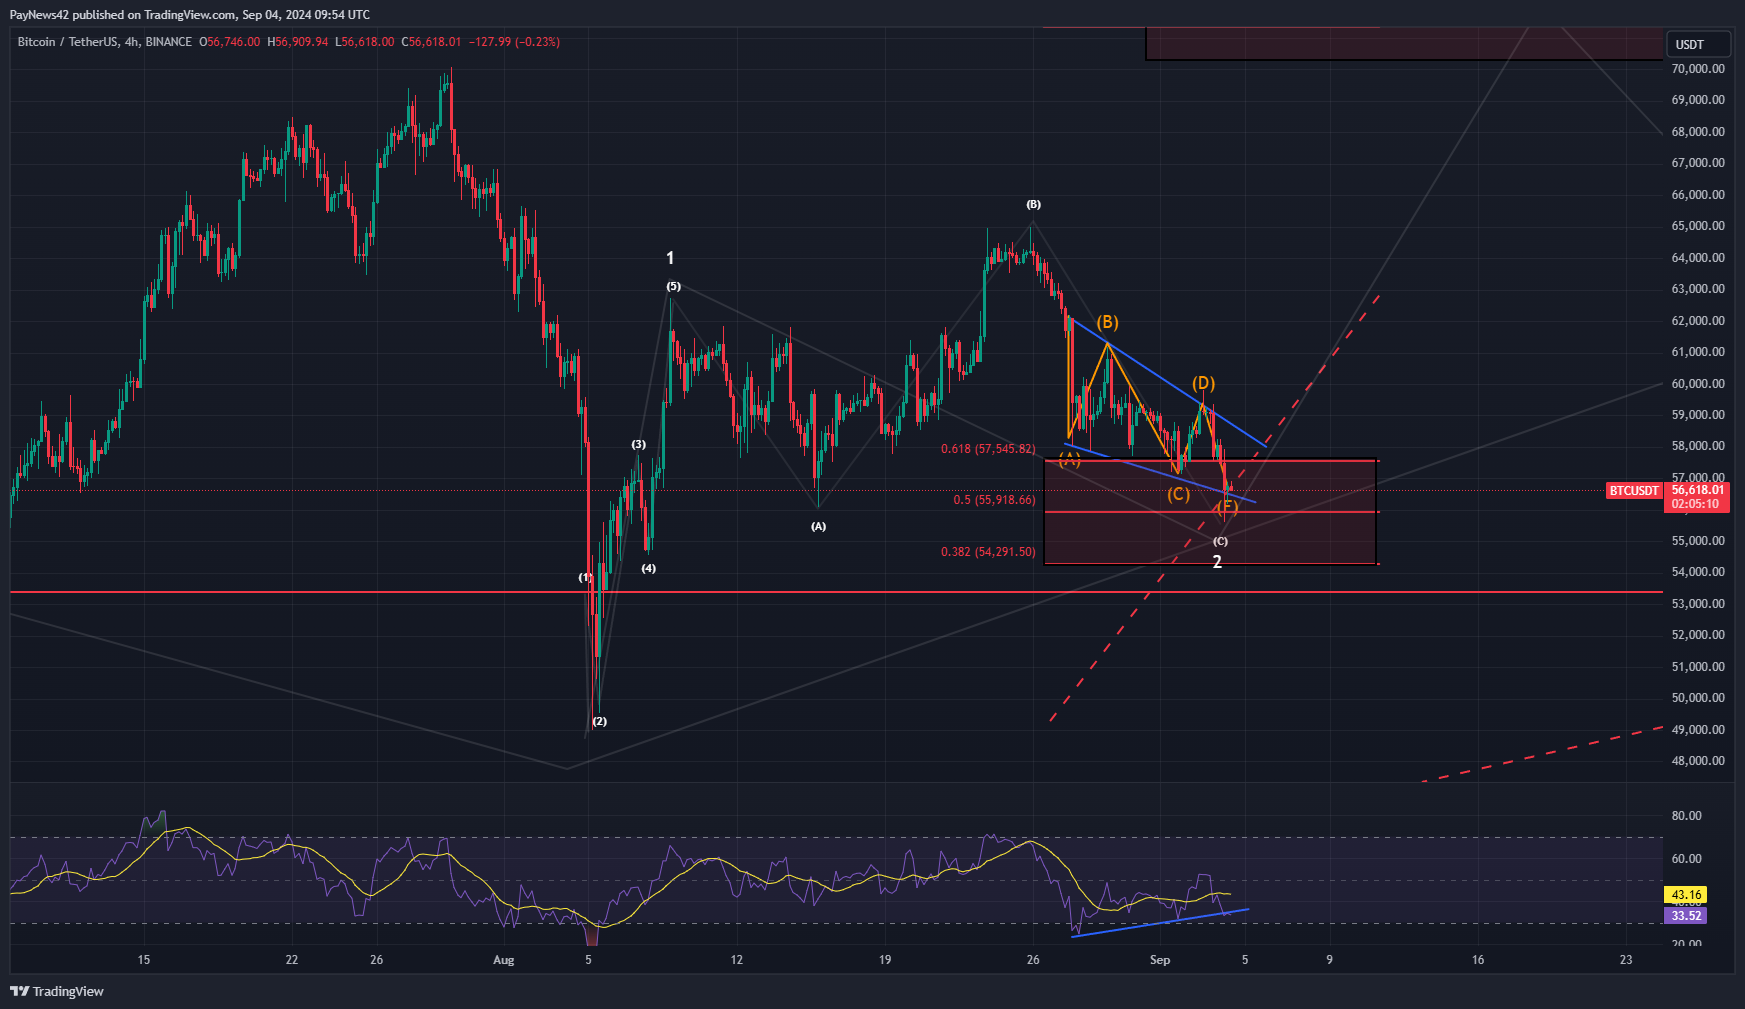
Bitcoin Low-Time-Frame Analysis Update
•
I’ve revised the low time frame analysis for Bitcoin, and the updated interpretation provides a more detailed and precise understanding of the current market dynamics. Key Observations: Bitcoin’s current market structure suggests that traders should remain cautious. While there are bullish signals, such as the descending triangle, their reliability is…
-
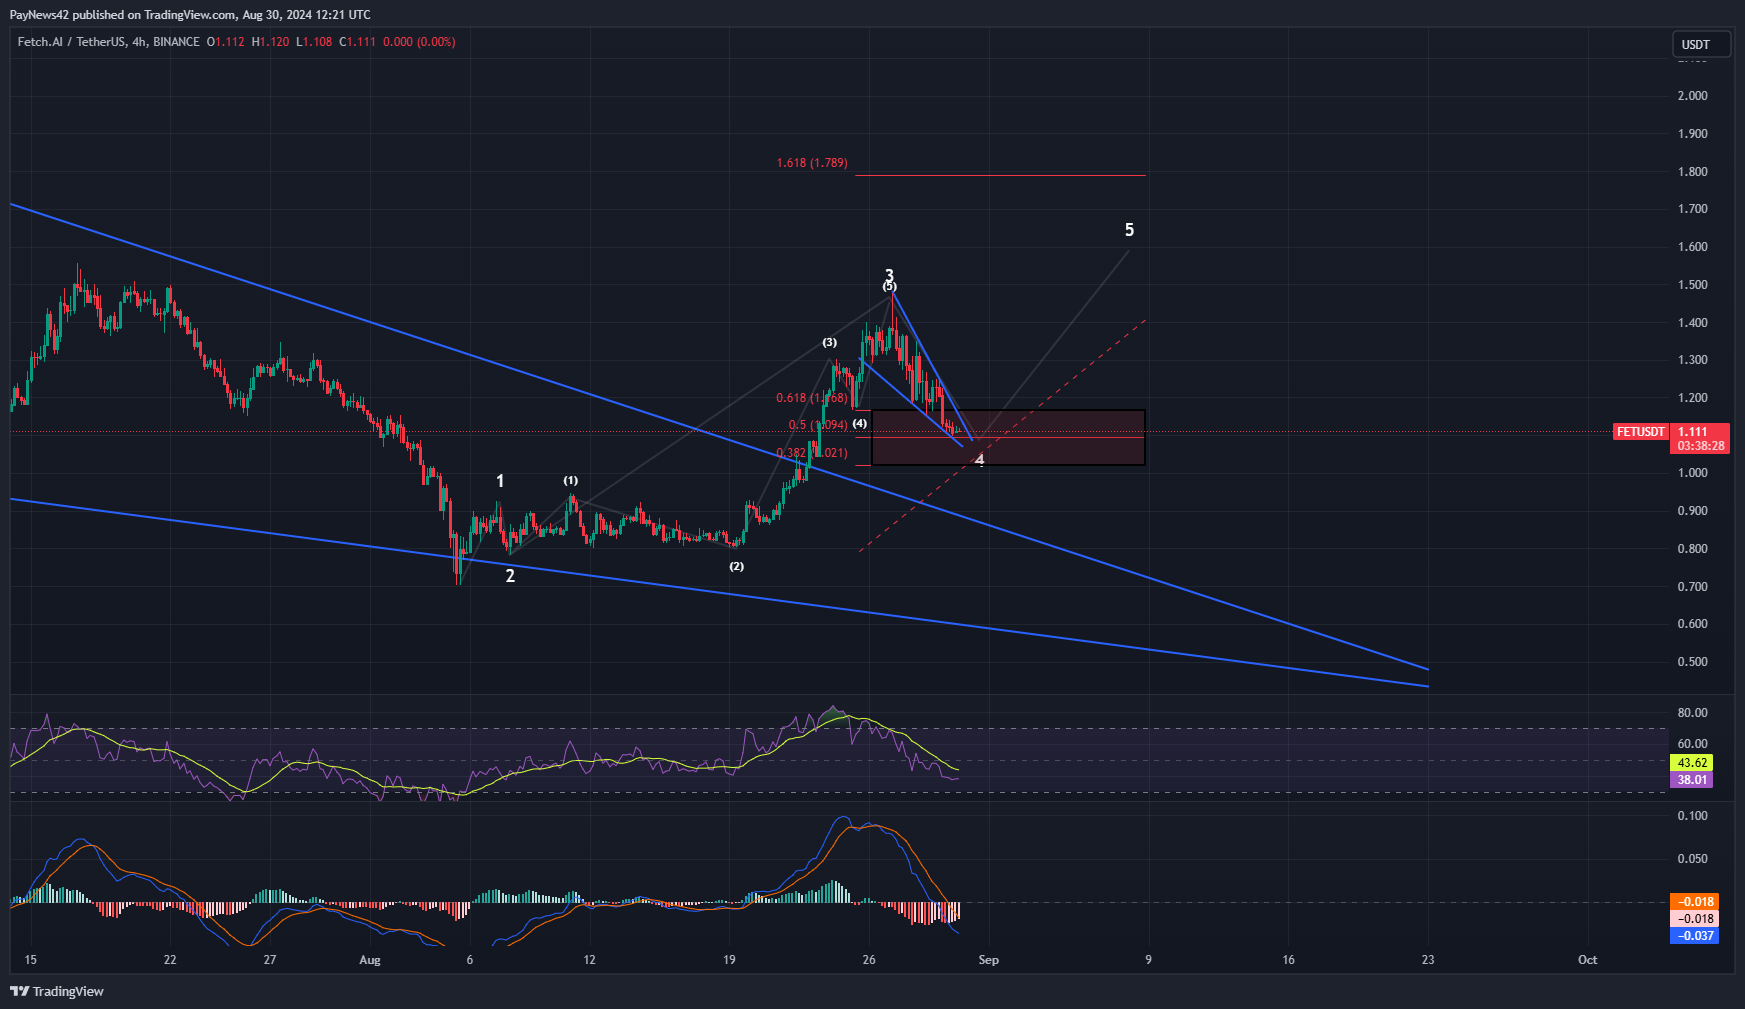
Fetch.AI (FET) Low-Time-Frame Analysis
•
Following the speculative surge driven by Nvidia’s earnings, $FET has experienced an incredible 107% increase. The price action has now developed into a clear three-wave structure and is currently in the process of forming Wave 4 within the larger bullish framework. Key Observations: Conclusion: FET has experienced a significant rally,…
-
Bitcoin Low-Time-Frame Analysis
•
In the aftermath of the unexpected 11% drop that occurred earlier this week, we’ve adjusted our wave count to better align with the current market conditions. This drop has introduced significant volatility, leading to a reevaluation of both bullish and bearish scenarios as we analyze Bitcoin’s next potential moves. Bullish…
-
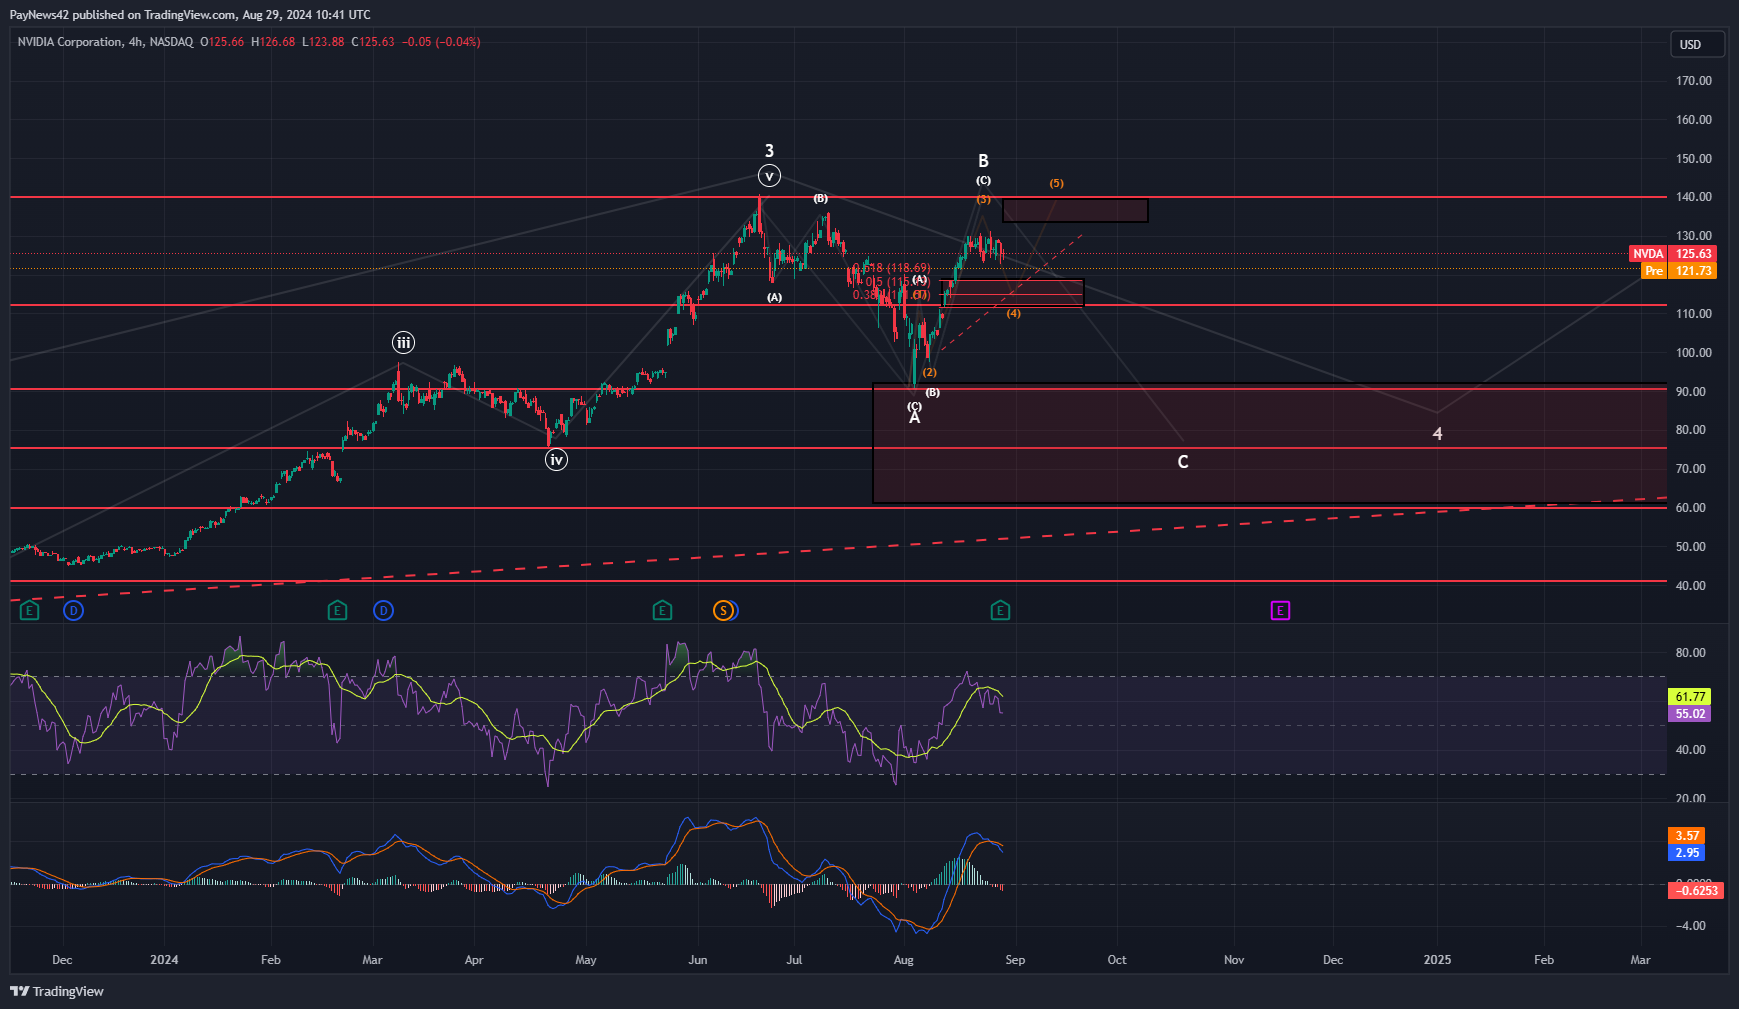
Nvidia Low Time Frame Analysis
•
After Nvidia released its earnings report yesterday, which was positive, the market reacted with a decline. Given this reaction, it is important to examine the current market structure more closely to understand the possible scenarios moving forward. Market Structure Overview: Since reaching the top of the overarching Wave 3 on…
-
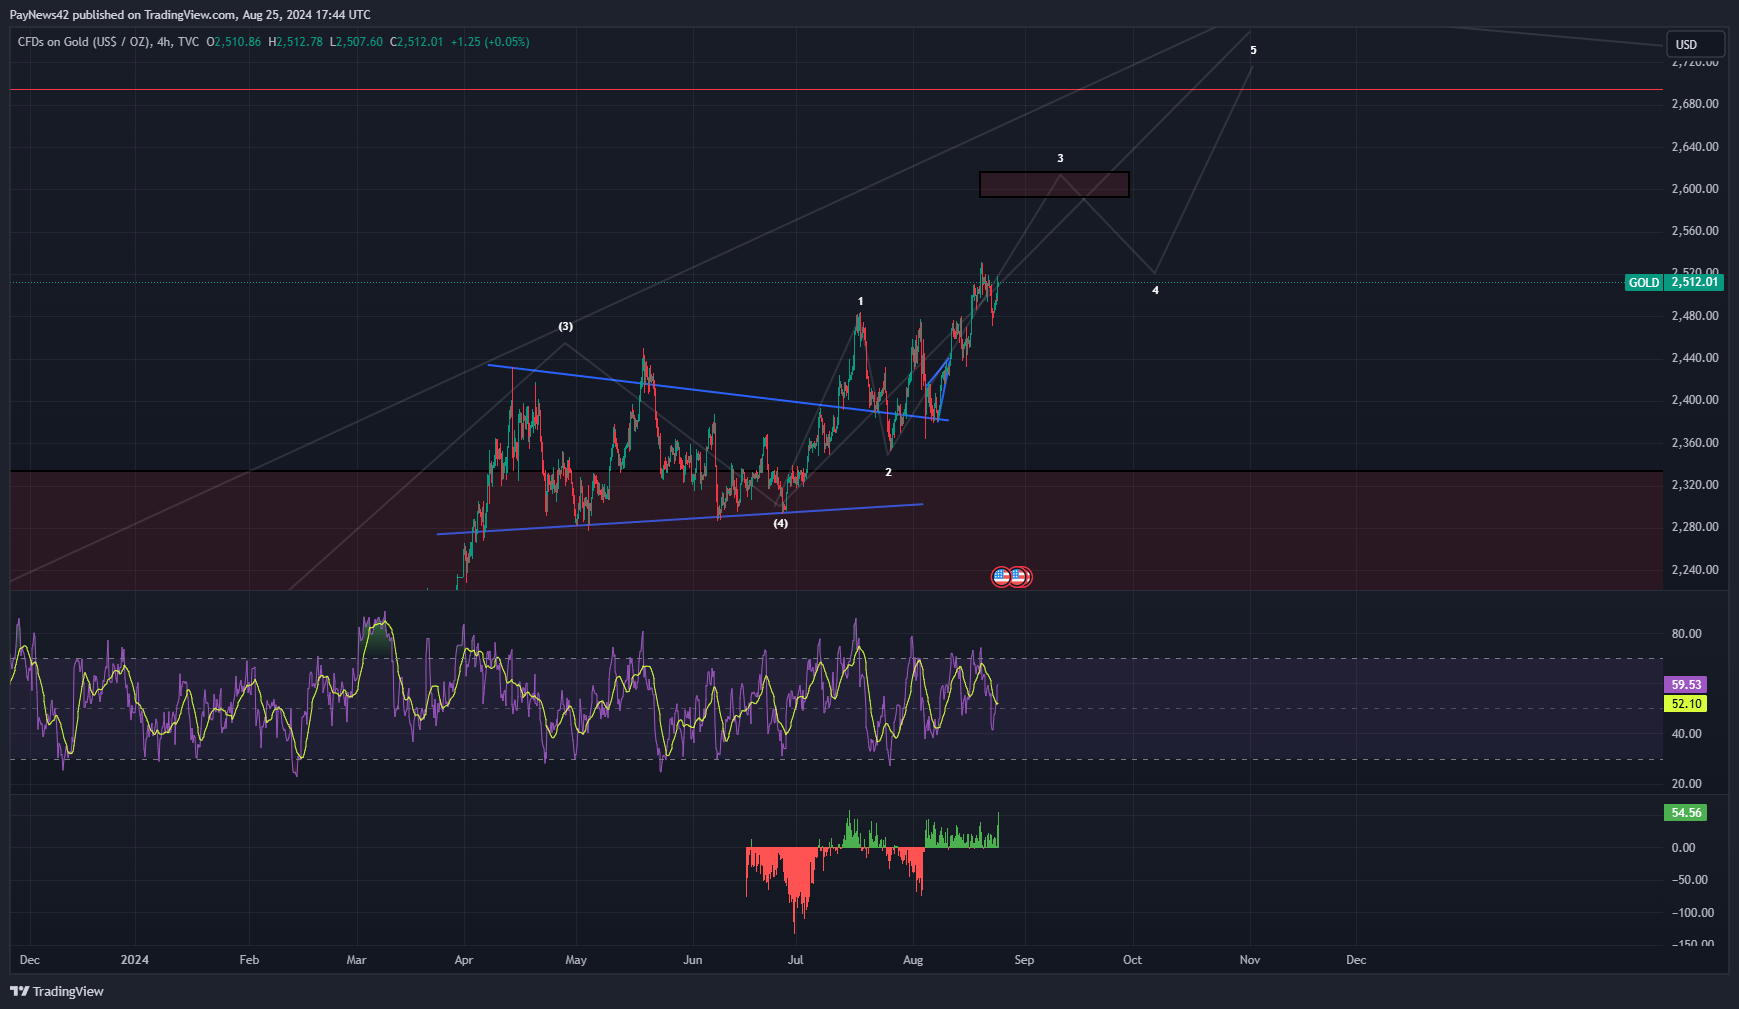
Gold Low-Time-Frame Analysis
•
According to our latest analysis, Gold remains firmly in Wave 5 of Greater Wave 3 after breaking out of the triangle pattern. Since this breakout, Gold has successfully completed Subwave 1 and 2, and we are now advancing through Subwave 3 of this larger wave structure. Subwave 3 Target Zone…