Tag: Bitcoin
-
Bitcoin
•
Bitcoin remains in the same HTF analysis as previously outlined. There are two potential scenarios: Low Time Frame (LTF) Analysis When analyzing the LTF, it appears that Wave 5 is taking the form of an ending diagonal. This is characterized by three-wave movements within each sub-wave of Wave 5, which…
-
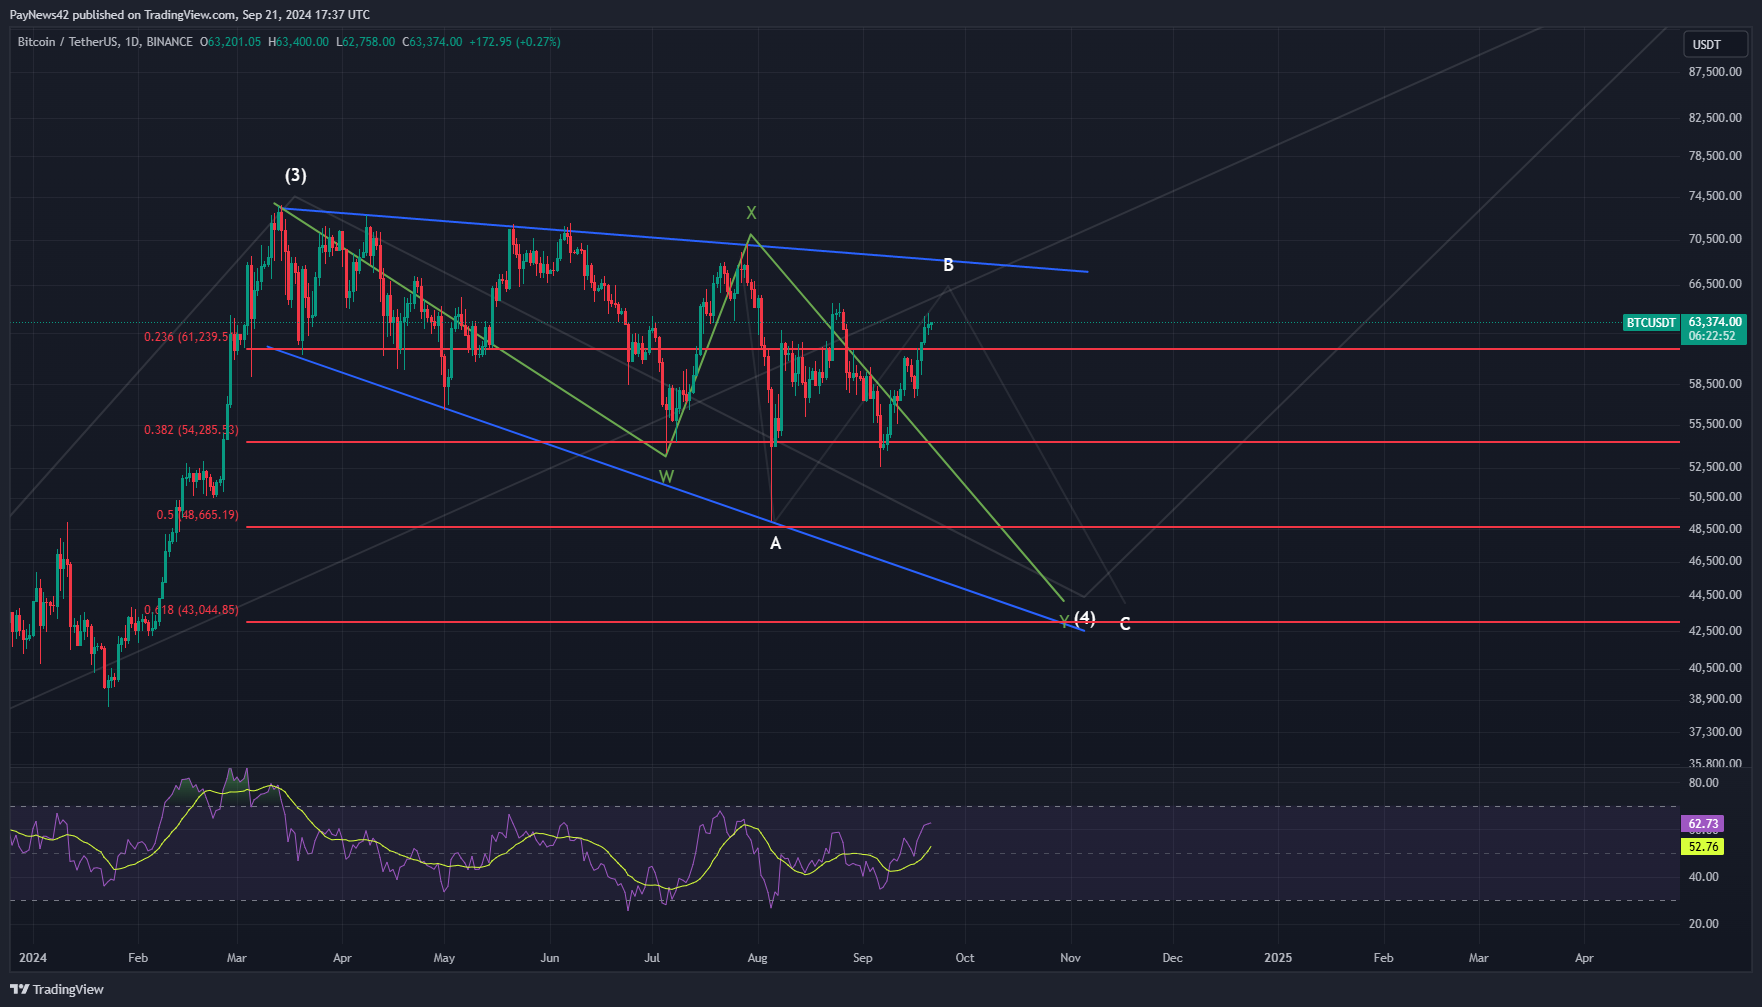
Bitcoin (BTC) Elliott Wave Analysis!
•
WXY Corrective Pattern Overview: Similar to our analysis on Solana, Bitcoin also appears to be following a WXY corrective structure. Within this pattern, the current market is completing a three-wave Y structure. We have already seen the completion of Wave A, and we are now navigating through Wave B, which…
-
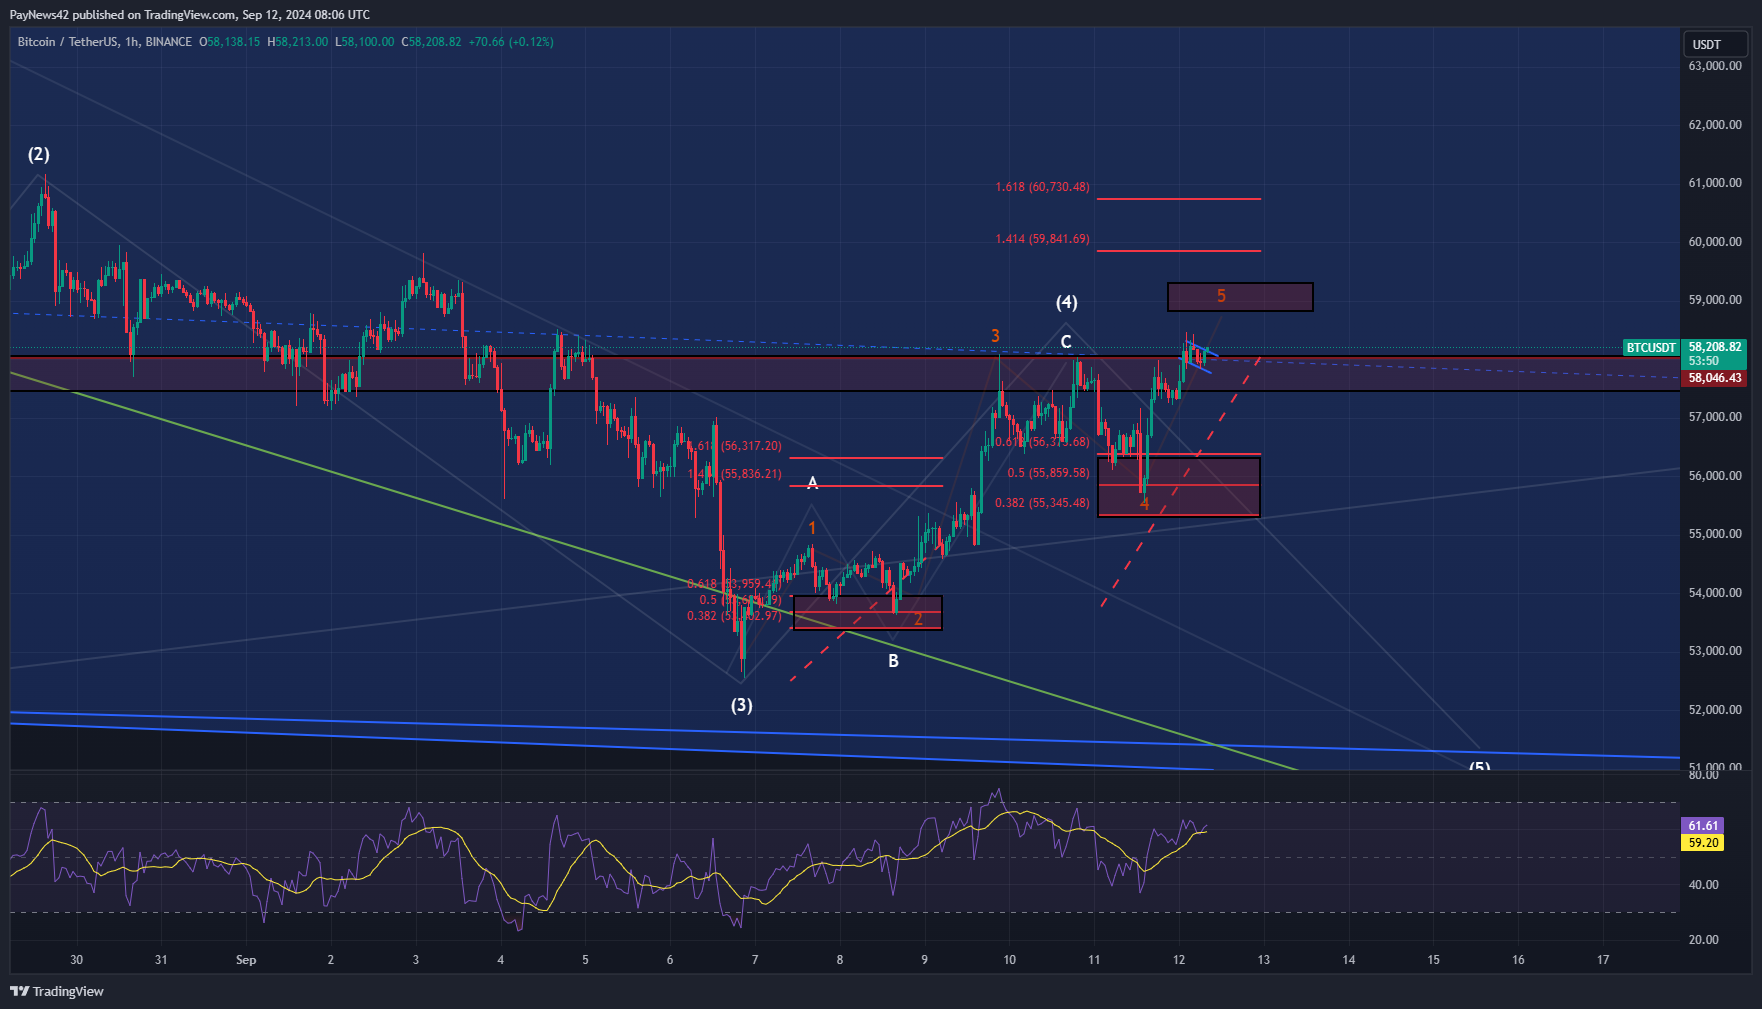
Bitcoin Elliott Wave Analysis
•
Bitcoin’s price action continues to display strength, and we have reintroduced the bullish scenario back into the chart analysis. As shown in yellow on the chart, Bitcoin has been respecting our key Fibonacci levels, both during the formation of Wave 2 and more recently in Wave 4. After finding support…
-
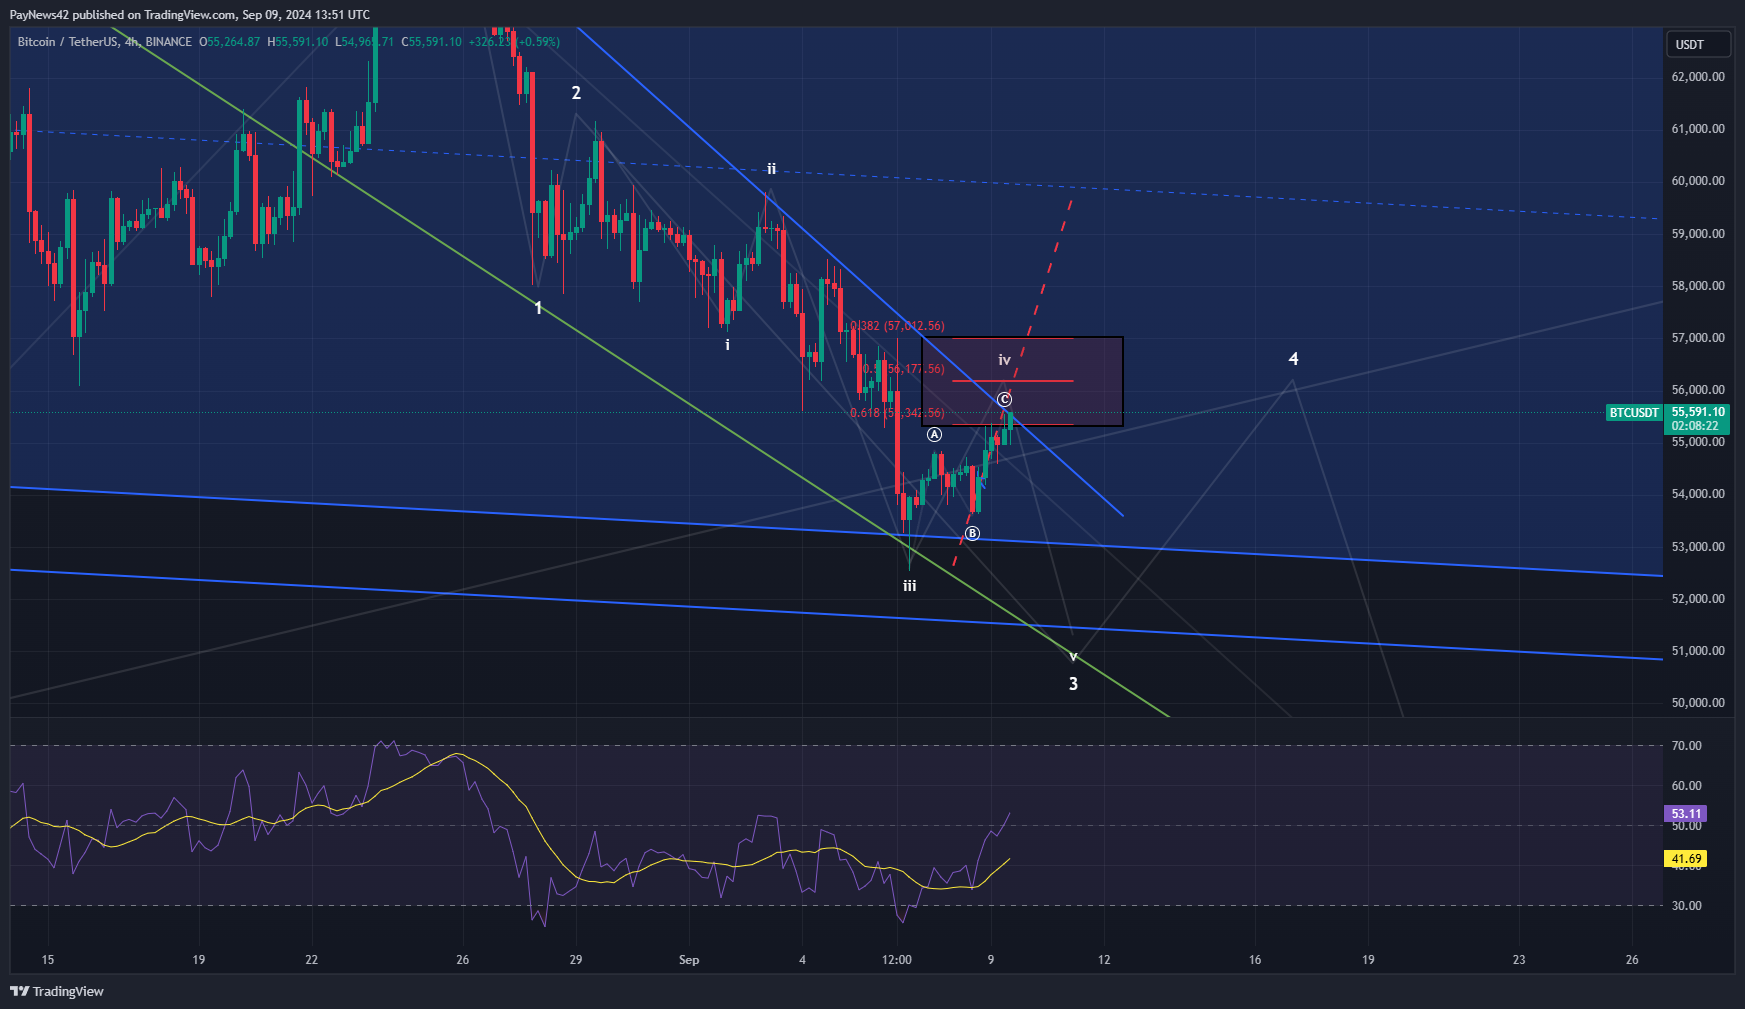
Bitcoin Low Time Frame Analysis
•
Current Market Situation: Bitcoin has shifted into a bearish scenario, as the bullish outlook has been invalidated. Based on the Elliott Wave count, Bitcoin is currently in Sub-Wave 4 of Wave 3, which is a corrective phase within a larger downward trend. The corrective structure is developing into a three-part…
-
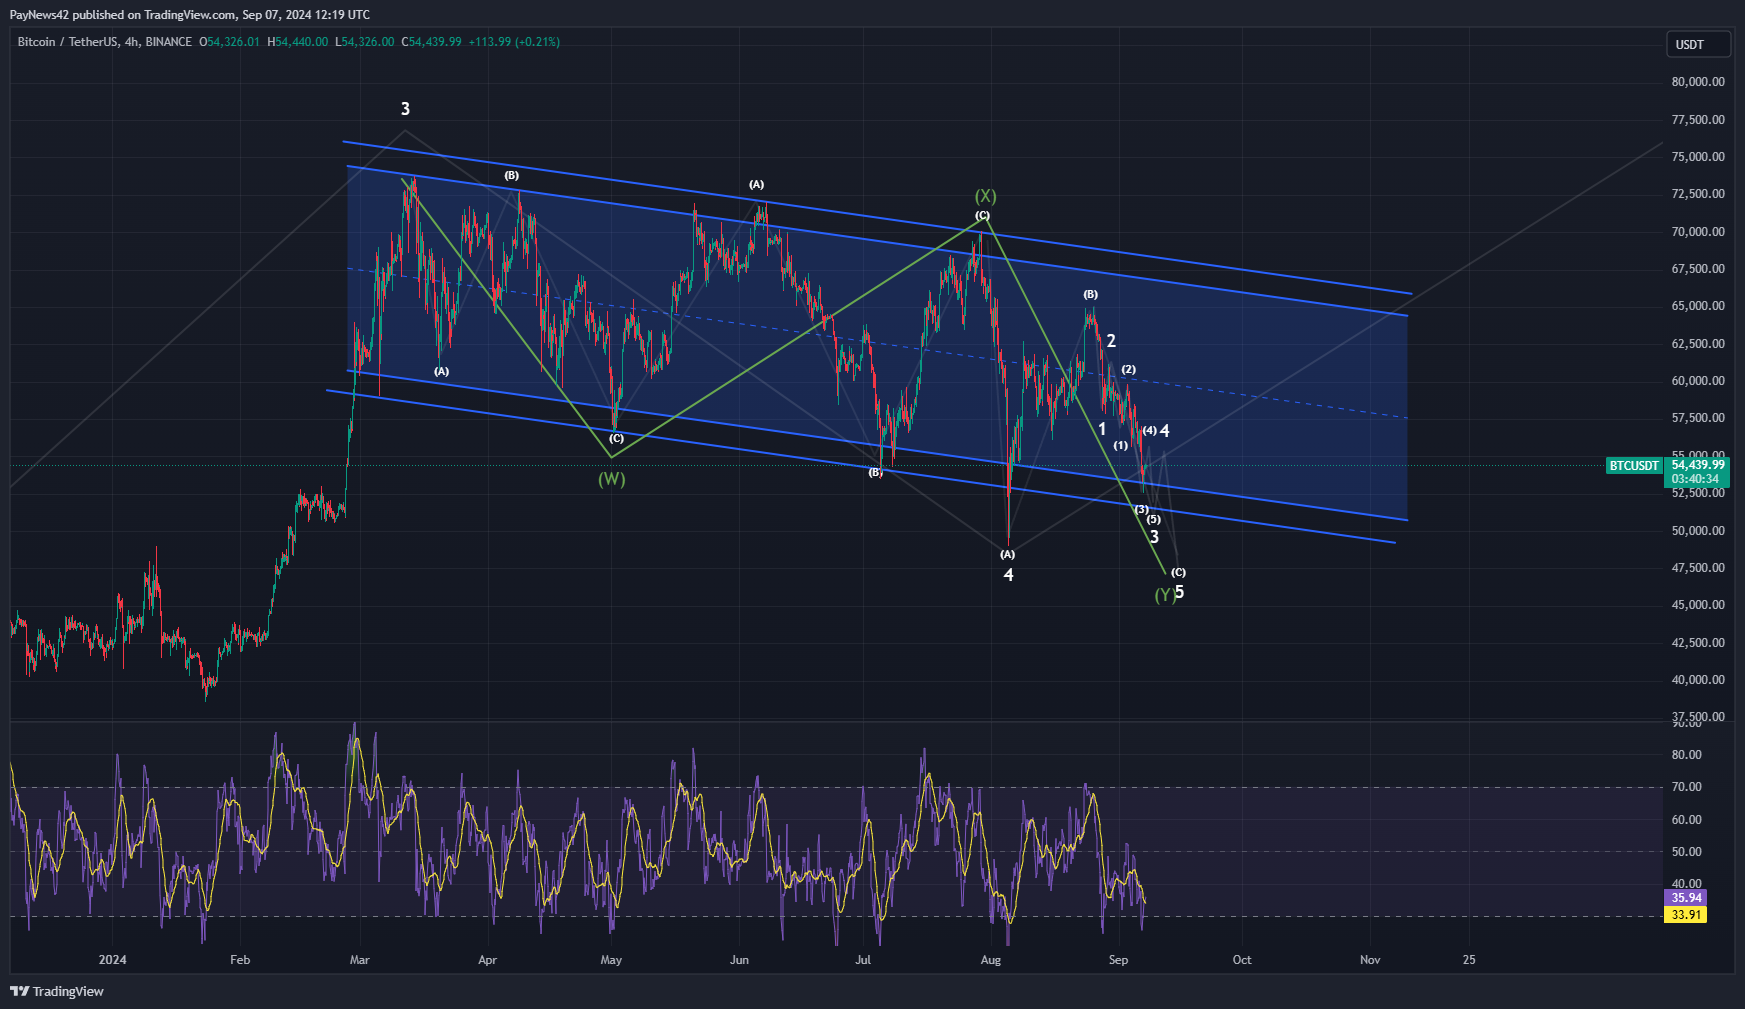
Bitcoin Medium Time Frame Analysis
•
Current Market Condition: Wave Count Breakdown: Wave 3 Breakdown: Short-Term Expectations: Bearish Outlook: Key Levels to Watch: Conclusion:
-
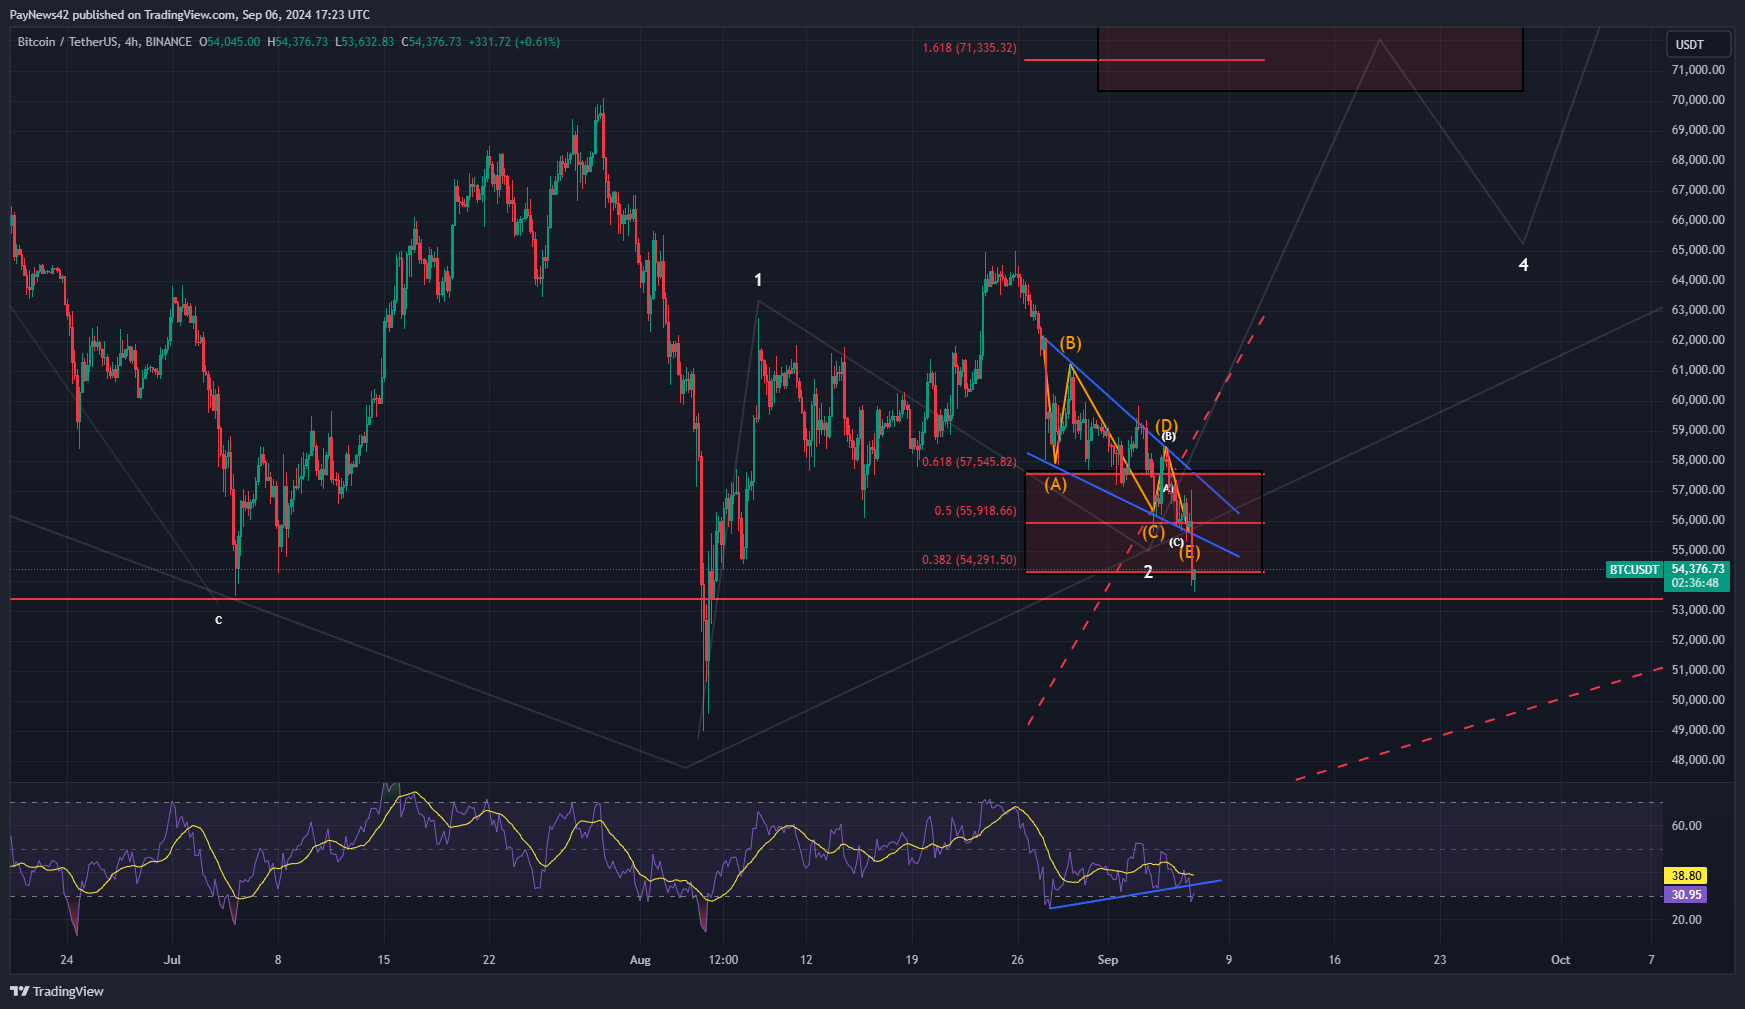
Low Time Frame Analysis Bitcoin
•
Recent Developments: What Does This Mean? Possible Scenarios: Indicators: Conclusion: The next few hours and days will be crucial to see whether Bitcoin finds support or continues its downward trend.
-
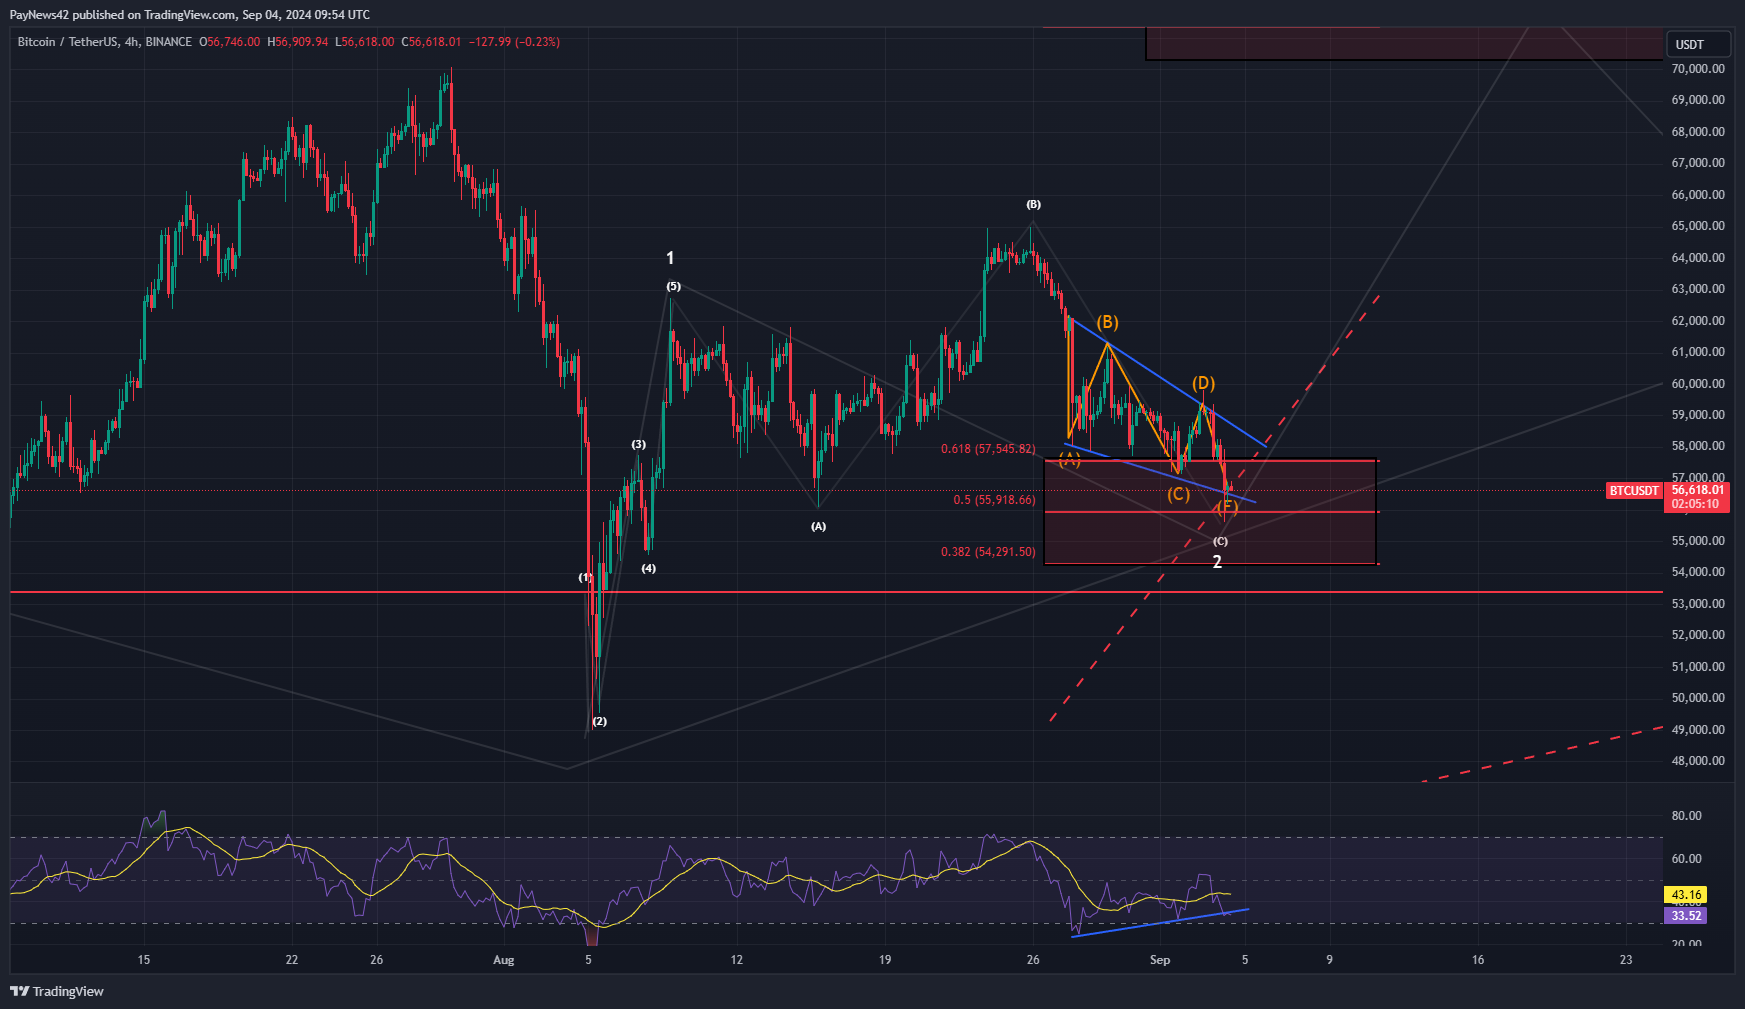
Have The Bears Won?
•
Current Market Situation: Wave Count Explanation: Technical Patterns and Indicators: Fibonacci Levels: Conclusion: Be mindful of potential downside if the wedge fails to hold, but at the moment, the bullish scenario still holds as the most likely outcome. Current Market Situation: Wave Count Explanation: Technical Patterns and Indicators: Fibonacci Levels:…
-
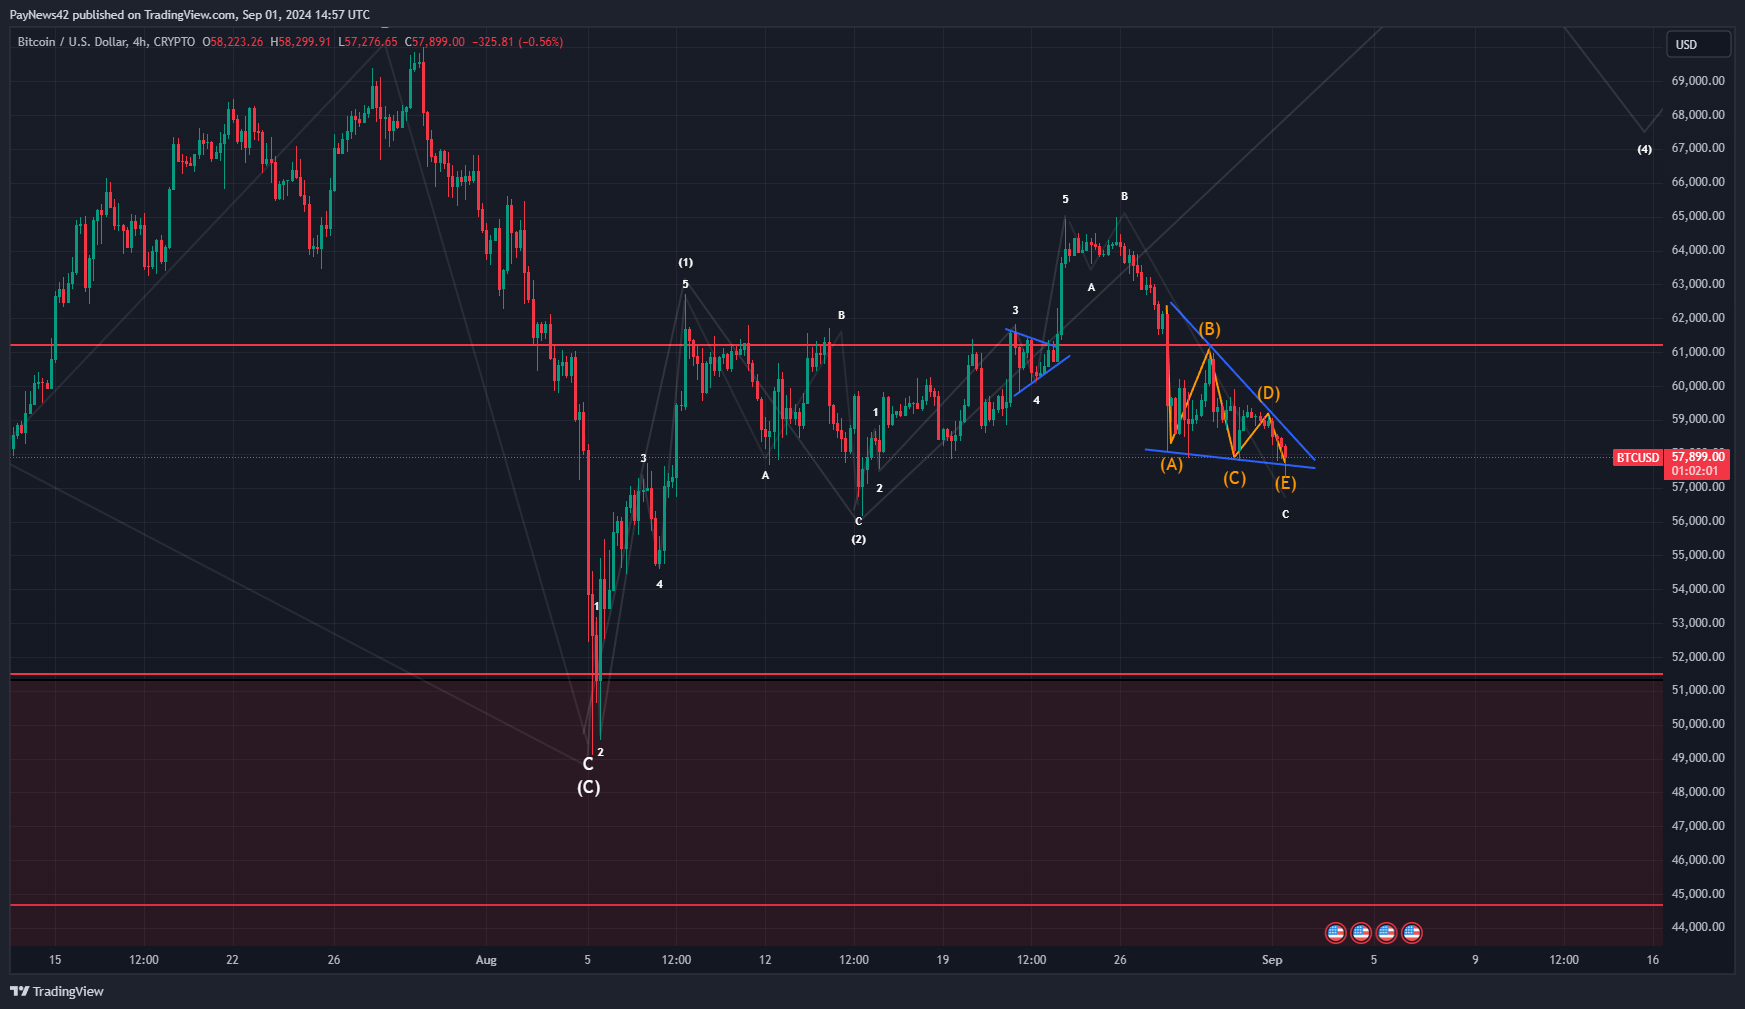
Bitcoin Low-Time-Frame Analysis
•
The chart illustrates a complex Elliott Wave structure and a potential falling wedge pattern, which is a key focus for the current price action. Let’s break it down: Conclusion: The market is at a critical juncture. A bullish breakout from the falling wedge would align with the larger Elliott Wave…
-
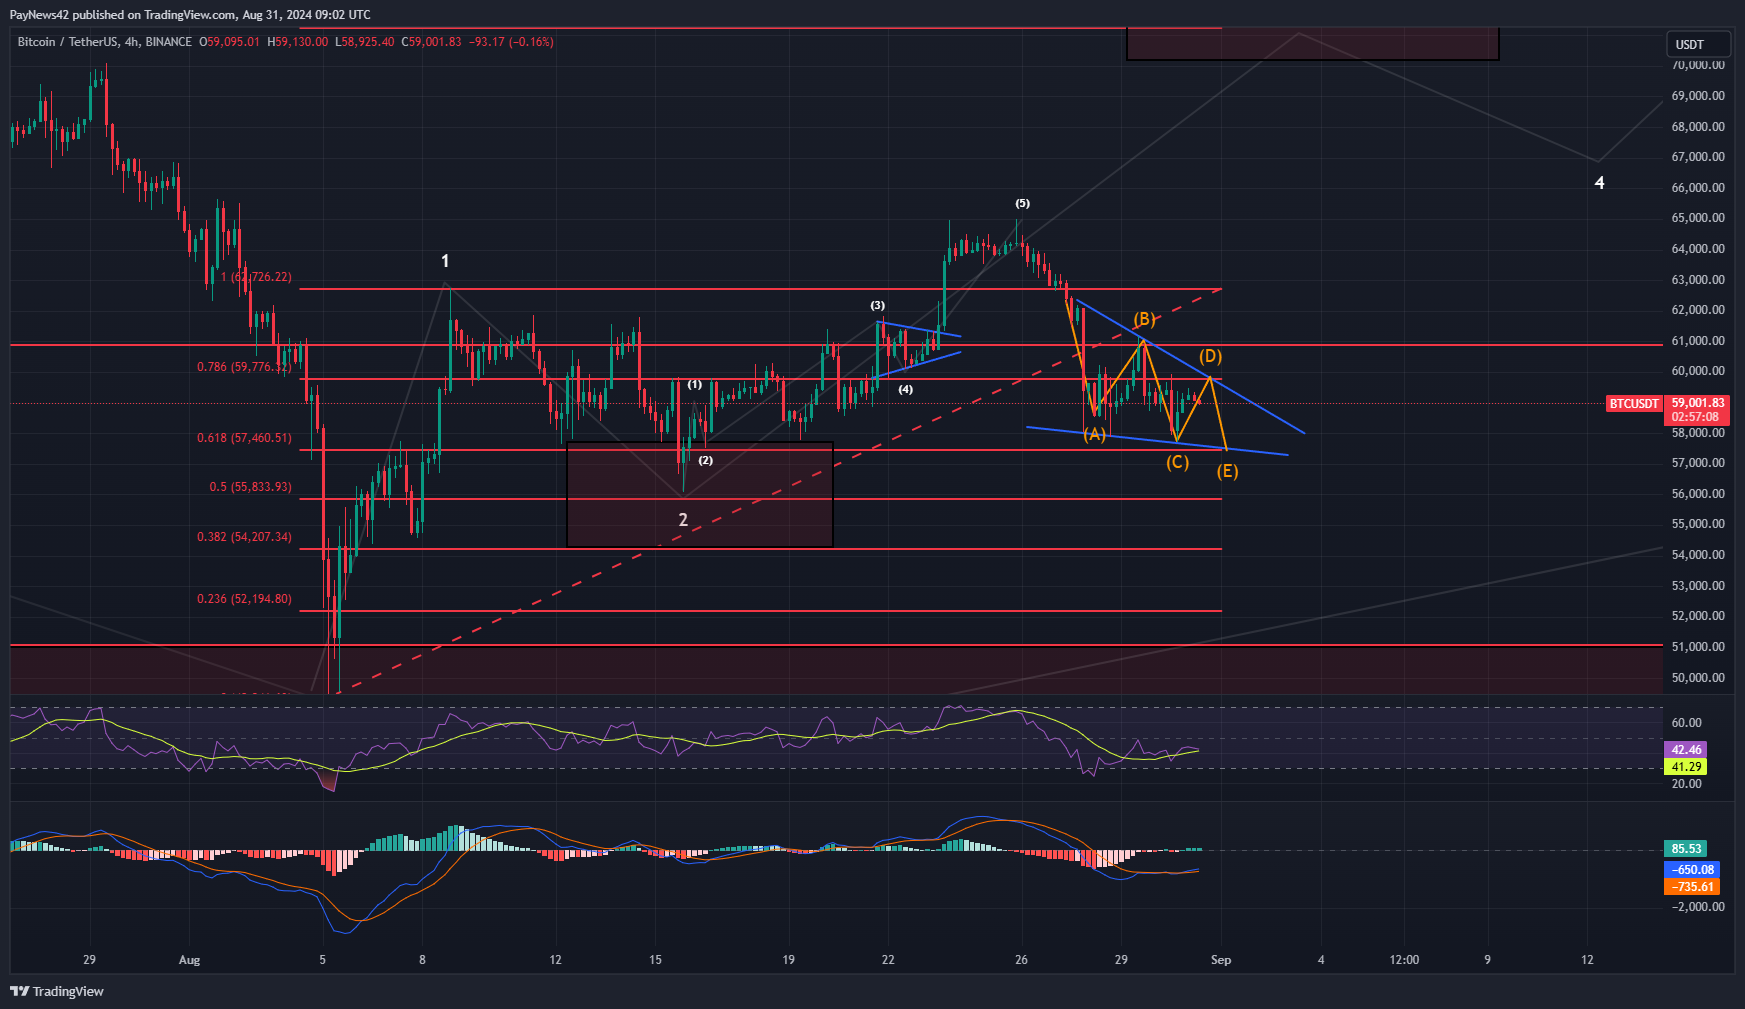
Bitcoin Low-Time-Frame Analysis
•
Bitcoin is currently moving within a falling triangle formation. Although this pattern is developing on a lower time frame, making it more fragile, it is still maintaining its structure. The falling triangle is typically seen as a bullish continuation pattern, especially when it occurs during a correction phase within an…
