Author: Lucas Peterson
-
•
SentiPredict SentiPredict Politic Sports War Global Leaderboard Login Registriere In Arbeit About Us
-
•
Sentipredict Markt 🔮 Sentipredict Markt Frage: Lädt… Status: – Contract-Adresse: Betrag in USDC: ✅ Wette auf JA ❌ Wette auf NEIN 💰 Auszahlung holen
-

Ripple
•
Status: Strong Sell After a comprehensive review of recent market trends, on-chain metrics, and historical price behavior, we have downgraded our rating for XRP from Hold to Strong Sell. Additionally, we have initiated a short position on XRP, reflecting our bearish outlook. This report outlines the key factors influencing our…
-
•
Rushbet – Polymarket Simulation Rushbet Wallet Profile Bets Will Bitcoin be over $200k by the end of 2025? Will February be a positive month for the crypto market? Will Solana outperform Ethereum in 2025? Buy Yes Buy No Price Yes: C42 Price No: C42 Send Close
-
DYNEX
•
Current Market Context Dynex represents our most speculative yet potentially lucrative trade. We view Dynex in a similar light to Ethereum in 2015, with massive upside potential and an incredibly undervalued position. With a limited supply of 110 million Dynex and a current price of around $0.20, the market capitalization…
-
Injective
•
Injective is our favorite altcoin, and we hold a strong conviction in its long-term potential. While we acknowledge that we are in the late stages of the bull market, we believe Injective has the potential for one more strong upward move before entering a broader market correction. Our target for…
-
FETCH.AI
•
Fetch.AI (FET) is another highly promising AI-focused token, similar to Render. Its strong narrative within the AI sector has driven significant attention and market momentum. However, we believe FET is currently within an ending diagonal pattern, signaling the final stages of a bullish macro wave. Technically, the chart suggests a…
-
RENDER
•
Current Market Context Render is one of the most promising altcoins in the current market, driven by the ongoing AI hype that boosts its adoption and visibility. We believe that Render is currently within its final macro bullish wave before a significant correction sets in. The wave structure indicates a…
-

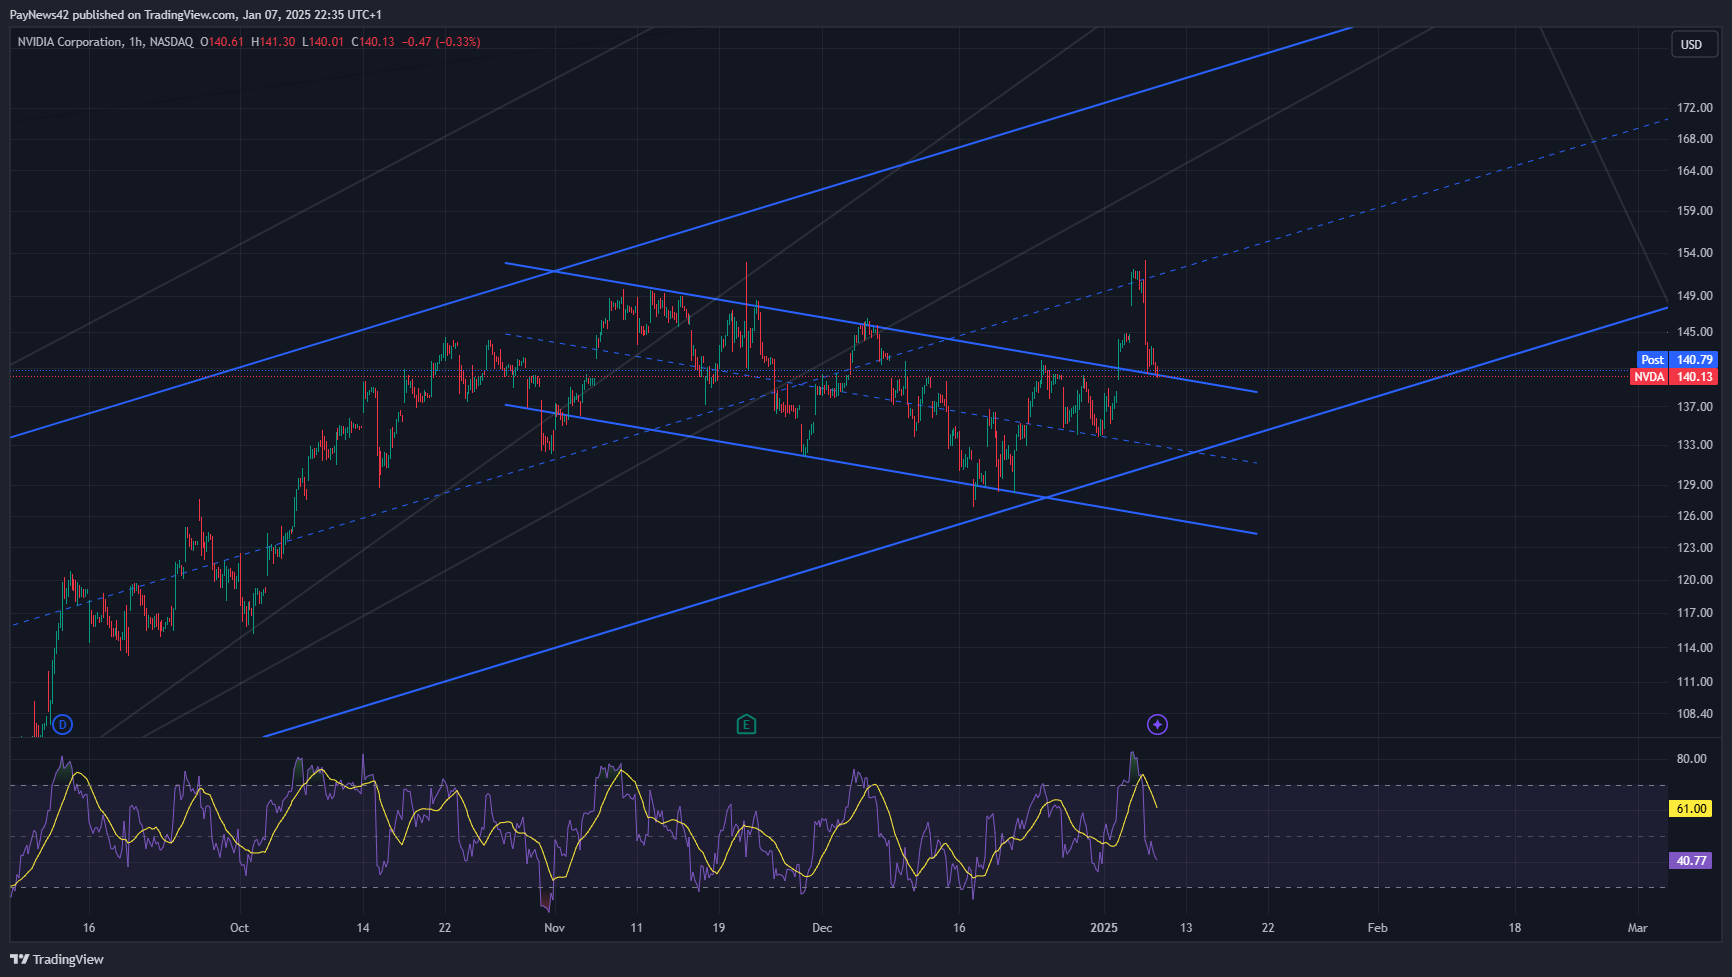
NVIDIA Research Report: Technical Analysis and Product Innovations January 2025!
•
DISCLAIMER: This is not financial advice. All information provided is for educational and entertainment purposes only. Trading and investing carry substantial risks – always conduct your own research and due diligence before making any investment decisions. Technical Analysis NVIDIA’s stock price is currently in a critical technical phase. After several…
-
•
Cytel42 Developers Individuals Institutions Ecosystem Press About The blockchain built for finance Build and use the best Web3 applications on Cytel42, the fastest layer 1 blockchain shaping the future of finance. Start Building Explore Ecosystem Oracle Derivatives Lending Order Book Smart Contracts Options Savings
